
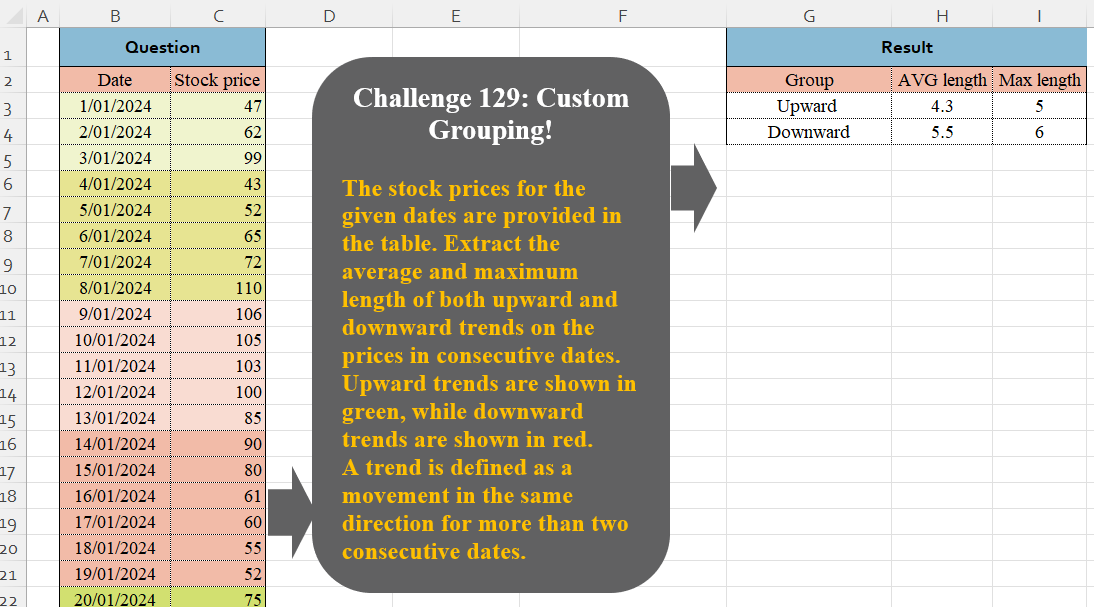
The stock prices for the given dates are provided in the table. Extract the average and maximum length of both upward and downward trends on the prices in consecutive dates. Upward trends are shown in green, while downward trends are shown in red. A trend is defined as a movement in the same direction for more than two consecutive dates.
📌 Challenge Details and Links
Challenge Number: 129
Challenge Difficulty: ⭐⭐⭐
📥Download Sample File
📥Link to the solutions on LinkedIn
Solving the challenge of Custom Grouping! Part 6 with Power Query
Power Query solution 1 for Custom Grouping! Part 6, proposed by Zoran Milokanović:
let
  Source = Excel.CurrentWorkbook(){[Name = "Input"]}[Content][Stock price],
  S = Table.Group(
    Table.FromRows(
      List.Accumulate(
        Source,
        {},
        (b, n) =>
          let
            l = List.Last(b),
            d = if n > l{0} then "Upward" else "Downward"
          in
            {b & {{n, null, 1}}, List.RemoveLastN(b) & {{n, d, l{2} + 1}}}{
              Byte.From(b <> {} and (l{1} = null or l{1} = d))
            }
      ),
      {"V", "Group", "L"}
    ),
    "Group",
    {{"AVG length", each List.Average([L])}, {"Max length", each List.Max([L])}}
  )
in
  S
Power Query solution 2 for Custom Grouping! Part 6, proposed by Alejandro Simón 🇵🇦 🇪🇸:
let
  Source = Excel.CurrentWorkbook(){[Name = "Table1"]}[Content],
  Dif = {0}
    & List.Transform(
      {1 .. List.Count(Source[Date]) - 1},
      each Source[Stock price]{_} - Source[Stock price]{_ - 1}
    ),
  Zero = {0}
    & List.Transform(
      {1 .. List.Count(Dif) - 1},
      each if Dif{_} < 0 and Dif{_ - 1} > 0 or Dif{_} > 0 and Dif{_ - 1} < 0 then 0 else Dif{_}
    ),
  Tbl = Table.FromColumns({Zero}),
  Index = Table.AddIndexColumn(Tbl, "Idx", 0),
  Group1 = Table.Group(
    Index,
    "Idx",
    {
      {
        "Group",
        each if List.AllTrue(List.Transform([Column1], each _ <= 0)) then "Downward" else "Upward"
      },
      {"B", each Table.RowCount(_)}
    },
    0,
    (a, b) => Number.From(Index[Column1]{b} = 0 and Index[Column1]{b - 1} <> 0)
  ),
  Group2 = Table.Group(
    Group1,
    "Group",
    {
      {
        "A",
        each
          let
            a = _,
            b = List.Max(a[B]),
            c = List.Average([B])
          in
            Table.FromColumns({{c}, {b}}, {"AVG length", "Max length"})
      }
    }
  ),
  Sol = Table.ExpandTableColumn(Group2, "A", Table.ColumnNames(Group2[A]{0}))
in
  Sol
Power Query solution 3 for Custom Grouping! Part 6, proposed by Kris Jaganah:
let
  A = Excel.CurrentWorkbook(){[Name = "Table1"]}[Content],
  B = Table.AddIndexColumn(A, "Id", 1),
  C = Table.AddColumn(
    B,
    "Diff",
    each try
      [Stock price] - (List.Range(A[Stock price], [Id] - 2, [Id] - 1){0})
    otherwise
      [Stock price]
  ),
  D = Table.AddColumn(
    C,
    "Group",
    each List.Accumulate(
      List.FirstN(C[Diff], [Id]),
      - 1,
      (x, y) =>
        if y >= 0 and x >= 0 then
          1 + x
        else if y >= 0 and x <= 0 then
          0
        else if y < 0 and x > 0 then
          0
        else
          x - 1
    )
  ),
  E = Table.AddColumn(
    D,
    "Direct",
    each List.Accumulate(List.FirstN(D[Group], [Id]), 0, (v, w) => if w = 0 then 1 + v else v)
  ),
  F = Table.AddColumn(
    E,
    "Max",
    each 1 + E[Group]{List.PositionOf(E[Direct], [Direct], Occurrence.Last)}
  ),
  G = Table.AddColumn(F, "Grp", each if [Max] > 0 then "Upward" else "Downward"),
  H = Table.Group(G, {"Grp", "Direct"}, {"Count", each Table.RowCount(_)}),
  I = Table.Group(
    H,
    {"Grp"},
    {{"Average", each List.Average([Count])}, {"Max", each List.Max([Count])}}
  )
in
  I
Power Query solution 4 for Custom Grouping! Part 6, proposed by 🇮🇷 Navid Esmaeilzadeh اسماعیل زاده:
let
  S = Excel.CurrentWorkbook(){[Name = "Table1"]}[Content],
  A = Table.AddIndexColumn(S, "i", 0, 1),
  B = Table.AddColumn(
    A,
    "d",
    each
      if (try [Stock price] - A[Stock price]{[i] - 1} otherwise [Stock price]) >= 0 then
        "Up"
      else
        "Down"
  ),
  C = Table.AddColumn(B, "d2", each if [d] = B[d]{[i] - 1} then "T" else "N"),
  D = Table.AddColumn(
    C,
    "d3",
    each try if [d2] = "N" and C[d2]{[i] - 1} <> "N" then [i] else null otherwise [i]
  ),
  E = Table.FillDown(D, {"d3"}),
  F = Table.Group(
    E,
    {"d3"},
    {{"Count", each Table.RowCount(_), Int64.Type}, {"T", each List.Last(_[d])}}
  ),
  G = Table.Group(
    F,
    {"T"},
    {
      {"Avg", each List.Average([Count]), type number},
      {"Max Lenght", each List.Max([Count]), type number}
    }
  ),
  H = Table.RenameColumns(G, {{"T", "Group"}})
in
  H
Solving the challenge of Custom Grouping! Part 6 with Excel
Excel solution 1 for Custom Grouping! Part 6, proposed by Bo Rydobon 🇹🇭:
=LET(
    z,
    C3:C26,
    y,
    SCAN(
        0,
        SEQUENCE(
            ROWS(
                z
            )
        ),
        LAMBDA(
            a,
            r,
            LET(
                c,
                INDEX(
                    z,
                    r
                ),

                q,
                N(
                    cINDEX(
                                z,
                                r-1,

                            )
                        ),
                        a,
                        q&MID(
                            a,
                            2,
                            2
                        )+1
                    )
                )
            )
        )
    ),
    g,
    GROUPBY(
        y,
        y,
        ROWS,
        ,
        0
    ),    l,
    -LEFT(
        TAKE(
            g,
            ,
            1
        )
    ),
    DROP(
        GROUPBY(
            HSTACK(
                l,
                IF(
                    l,
                    "Up",
                    "Down"
                )&"ward"
            ),
            DROP(
            g,
            ,
            1
        ),
            HSTACK(
                AVERAGE,
                MAX
            ),
            ,
            0
        ),
        ,
        1
    )
)
Excel solution 2 for Custom Grouping! Part 6, proposed by Oscar Mendez Roca Farell:
=LET(b,
    B3:B26,
    c,
    C3:C26,
    a,
    VSTACK(
        0,
        DROP(
            c,
            -1
        )
    ),
    e,
    VSTACK(
        DROP(
            c,
            1
        ),
        0
    ),
    F,
    LAMBDA(
        i,
        j,
        LET(
            f,
            FREQUENCY(
                IF(
                    i=j,
                    b
                ),
                IF(
                    i<>j,
                    b
                )
            ),
            g,
            1+FILTER(
                f,
                f>1
            ),
            HSTACK(
                AVERAGE(
                    g
                ),
                MAX(
                    g
                )
            )
        )
    ),
    HSTACK({"Up";"Down"}&"ward",
    VSTACK(F((c>a)+(e>a),
    2),
    F((c
Excel solution 3 for Custom Grouping! Part 6, proposed by Kris Jaganah:
=LET(a,
    C3:C26,
    b,
    a-VSTACK(
        0,
        DROP(
            a,
            -1
        )
    ),
    c,
    SCAN(-1,
    b,
    LAMBDA(x,
    y,
    IFS((y>=0)*(x>=0),
    1+x,
    (y>=0)*(x<=0),
    0,
    (y<0)*(x>0),
    0,
    1,
    x-1))),
    d,
    SCAN(
        0,
        c,
        LAMBDA(
            v,
            w,
            IF(
                w=0,
                1+v,
                v
            )
        )
    ),
    e,
    XLOOKUP(
        d,
        d,
        c,
        ,
        ,
        -1
    )+1,
    f,
    IF(
        e<0,
        "Down",
        "Up"
    )&"ward",
    g,
    GROUPBY(
        HSTACK(
            f,
            d
        ),
        e,
        COUNT,
        ,
        0,
        -1
    ),
    GROUPBY(
        TAKE(
            g,
            ,
            1
        ),
        TAKE(
            g,
            ,
            -1
        ),
        HSTACK(
            AVERAGE,
            MAX
        ),
        ,
        0,
        -1
    ))
Excel solution 4 for Custom Grouping! Part 6, proposed by Talia Cao, CPA:
=LET(p,
    C3:C26,
    s,
    SIGN(
        p-N(
            +OFFSET(
                p,
                -1,

            )
        )
    ),
    c,
    SEQUENCE(
        ROWS(
            p
        )
    ),
    n,
     SCAN(
         0,
         c,
         LAMBDA(
             a,
             v,
             IF(
                 v=1,
                 ,
                 IF(
                     INDEX(
                         s,
                         v
                     )<>INDEX(
                         s,
                         v-1
                     ),
                     a+1,
                     a
                 )
             )
         )
     ),
    m,
     IFERROR(IF(c=1,
    ,
    IF((n<>INDEX(
        n,
        c-1
    ))*(n<>INDEX(
        n,
        c+1
    )),
    n+1,
    n)),
    n),
    g,
     DROP(
         GROUPBY(
             m,
             s,
             HSTACK(
                 MEDIAN,
                 ROWS
             ),
             ,
             0
         ),
         1,
         1
     ),
    GROUPBY(
        IF(
            TAKE(
                g,
                ,
                1
            )=1,
            "Up",
            "Down"
        )&"ward",
        TAKE(
            g,
            ,
            -1
        ),
        HSTACK(
            AVERAGE,
            MAX
        ),
        ,
        0,
        -1
    ))
Solving the challenge of Custom Grouping! Part 6 with Python in Excel
Python in Excel solution 1 for Custom Grouping! Part 6, proposed by Alejandro Campos:
df = xl("B2:C26", headers=True)
df['asc'] = (df['Stock price'].diff() > 0).cumsum()
df['desc'] = (df['Stock price'].diff() < 0).cumsum()
df['asc_f'] = df.groupby('asc')['asc'].transform(lambda x: x if len(x) > 2 else pd.NA)
df['desc_f'] = df.groupby('desc')['desc'].transform(lambda x: x if len(x) > 2 else pd.NA)
df['seq'] = df.apply(lambda r: r['asc_f'] if pd.notna(r['asc_f']) and pd.isna(r['desc_f']) else (
 r['desc_f'] if pd.notna(r['desc_f']) and pd.isna(r['asc_f']) else (
 min(r['asc_f'], r['desc_f']) if pd.notna(r['asc_f']) and pd.notna(r['desc_f']) else pd.NA
 )
), axis=1)
df['dif'] = df['Stock price'].diff().fillna(0)
df['dir'] = df.groupby('seq')['dif'].transform(lambda x: 1 if x.gt(0).sum() > x.lt(0).sum() else -1)
df['Group'] = df['dir'].map({1: 'Upward', -1: 'Downward'})
res = df.groupby(['Group', 'seq']).size().reset_index(name='days')
res = res.groupby('Group')['days'].agg(AVG_length=('mean'), Max_length=('max')).sort_values(by='Group', ascending=False).reset_index()
Solving the challenge of Custom Grouping! Part 6 with R
R solution 1 for Custom Grouping! Part 6, proposed by Konrad Gryczan, PhD:
library(tidyverse)
library(readxl)
path = "files/CH-129 Custom Grouping.xlsx"
input = read_excel(path, range = "B2:C26") %>% janitor::clean_names()
test = read_excel(path, range = "G2:I4")
result = input %>%
 mutate(a = cumsum(lag(stock_price, default = 0) > stock_price),
 d = cumsum(lag(stock_price, default = 0) < stock_price)) %>%
 mutate(a_n = ifelse(n() > 2, a, NA), .by = a) %>%
 mutate(d_n = ifelse(n() > 2, d, NA), .by = d) %>%
 mutate(check = case_when(
 !is.na(a_n) & is.na(d_n) ~ a_n,
 !is.na(d_n) & is.na(a_n) ~ d_n,
 !is.na(a_n) & !is.na(d_n) ~ pmin(a_n, d_n),
 TRUE ~ NA_real_
 )) %>%
 mutate(diff = stock_price - lag(stock_price, default = 0)) %>%
 mutate(sign = sign(median(diff)),
 Group = ifelse(sign == 1, "Upward", "Downward"),
 .by = check) %>%
 summarise(n = n(), .by = c(Group,check)) %>%
 summarise(`AVG Lenght` = mean(n), `Max Length` = max(n), .by = Group)
all.equal(result, test, check.attributes = FALSE)
#> [1] TRUE
Solving the challenge of Custom Grouping! Part 6 with Google Sheets
Google Sheets solution 1 for Custom Grouping! Part 6, proposed by Peter Krkos:
PowerQuery solution:
https://docs.google.com/spreadsheets/d/1zR5IZLz8OT76vhaPEHfsPrw8-RDKnLyyqS49IJjdhFk/edit?pli=1&gid=1308140872#gid=1308140872