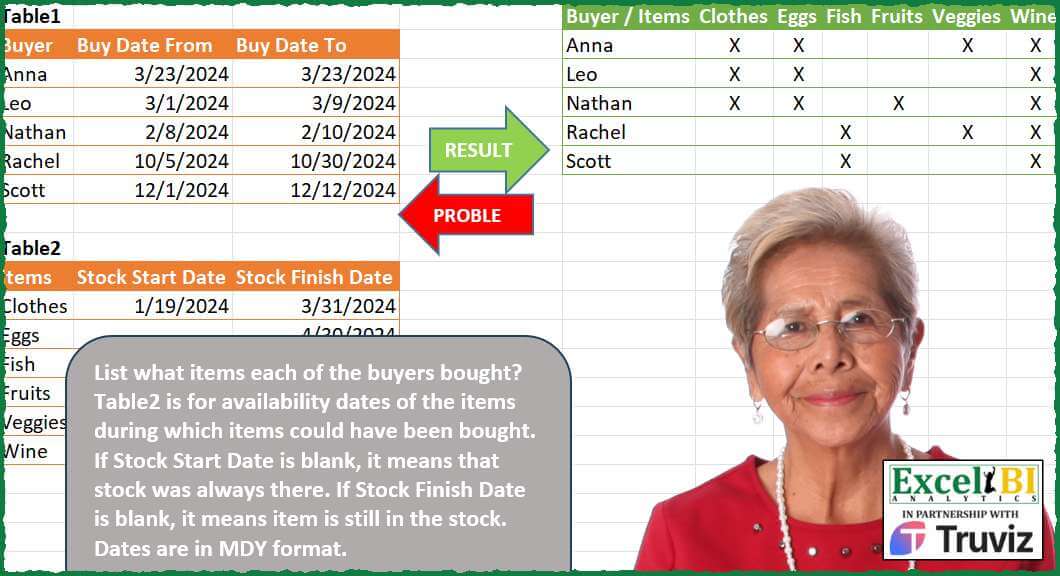
List what items each of the buyers bought? Table2 is for availability dates of the items during which items could have been bought. If Stock Start Date is blank, it means that stock was always there. If Stock Finish Date is blank, it means item is still in the stock. Dates are in MDY format.
📌 Challenge Details and Links
ExcelBI Power Query Challenge Number: 201
Challenge Difficulty: ⭐️⭐️⭐️
📥Download Sample File
📥Link to the solutions on LinkedIn
Solving the challenge of Map Buyer Purchase Dates with Power Query
Power Query solution 1 for Map Buyer Purchase Dates, proposed by Zoran Milokanović:
let
  Source = each Excel.CurrentWorkbook(){[Name = _]}[Content],
  T2 = Source("Table2"),
  S = Table.FromRows(
    List.TransformMany(
      Table.ToRows(Source("Table1")),
      each {Table.ToRows(T2)},
      (i, _) => {i{0}}
        & List.Transform(
          _,
          each {null, "X"}{Byte.From(i{1} <= (_{2} ?? i{1}) and i{2} >= (_{1} ?? i{2}))}
        )
    ),
    {"Buyer / Items"} & T2[Items]
  )
in
  S
Power Query solution 2 for Map Buyer Purchase Dates, proposed by Kris Jaganah:
let
  S = each Excel.CurrentWorkbook(){[Name = _]}[Content],
  Calc = Table.AddColumn(
    S("Table2"),
    "Buyer / Items",
    each [
      a = List.Combine(List.RemoveFirstN(Table.ToColumns(S("Table1")))),
      b = if [Stock Start Date] = null then List.Min(a) else [Stock Start Date],
      c = if [Stock Finish Date] = null then List.Max(a) else [Stock Finish Date],
      d = Table.SelectRows(
        S("Table1"),
        (x) =>
          x[Buy Date From]
            >= b and x[Buy Date To]
            <= c or x[Buy Date To]
            >= b and x[Buy Date From]
            <= c
      )[Buyer]
    ][d]
  ),
  Xpand = Table.ExpandListColumn(Calc, "Buyer / Items"),
  Keep = Table.SelectColumns(Xpand, {"Buyer / Items", "Items"}),
  Pivot = Table.Pivot(
    Keep,
    List.Distinct(Keep[Items]),
    "Items",
    "Items",
    each if List.NonNullCount(_) > 0 then "X" else null
  )
in
  Pivot
Power Query solution 3 for Map Buyer Purchase Dates, proposed by Aditya Kumar Darak 🇮🇳:
let
 Table1 = Excel.CurrentWorkbook(){[ Name = "Table1" ]}[Content],
 Table2 = Excel.CurrentWorkbook(){[ Name = "Table2" ]}[Content],
 Dates  = Table.AddColumn (
 Table2,
 "List",
 each [
 S = [Stock Start Date] ?? List.Min ( Table2[Stock Start Date] & Table1[Buy Date From] ),
 E = [Stock Finish Date] ?? List.Max ( Table2[Stock Finish Date] & Table1[Buy Date To] ),
 L = List.DateTimes ( S, Duration.Days ( E - S ) + 1, hashtag#duration ( 1, 0, 0, 0 ) )
 ][L]
 ),
 Expand = Table.ExpandListColumn ( Dates, "List" ),
 Unpivot = Table.UnpivotOtherColumns ( Table1, { "Buyer" }, "Type", "Date" ),
 Join  = Table.Join ( Expand, "List", Unpivot, "Date" )[[Buyer], [Items], [List]],
 Return = Table.Pivot (
 Join,
 Table2[Items],
 "Items",
 "List",
 ( x ) => if List.Count ( x ) > 0 then "X" else null
 )
in
 Return
Power Query solution 4 for Map Buyer Purchase Dates, proposed by Alejandro Simón 🇵🇦 🇪🇸:
let
  Tbl1 = Table.AddColumn(
    Excel.CurrentWorkbook(){[Name = "Table1"]}[Content],
    "A",
    each List.Transform({Number.From([Buy Date From]) .. Number.From([Buy Date To])}, Date.From)
  )[[Buyer], [A]],
  Tbl2 = Table.AddColumn(
    Excel.CurrentWorkbook(){[Name = "Table2"]}[Content],
    "B",
    each List.Transform(
      {
        Number.From(Date.From([Stock Start Date]) ?? List.Min(List.Combine(Tbl1[A]))) .. Number.From(
          Date.From([Stock Finish Date]) ?? List.Max(List.Combine(Tbl1[A]))
        )
      },
      Date.From
    )
  )[[Items], [B]],
  Comb = Table.AddColumn(
    Tbl1,
    "C",
    (x) =>
      Table.PromoteHeaders(
        Table.Transpose(
          Table.AddColumn(Tbl2, "D", each if List.ContainsAny([B], x[A]) then "X" else null)[
            [Items],
            [D]
          ]
        )
      )
  )[[Buyer], [C]],
  Sol = Table.ExpandTableColumn(Comb, "C", Table.ColumnNames(Comb[C]{0}))
in
  Sol
Power Query solution 5 for Map Buyer Purchase Dates, proposed by Eric Laforce:
let
 Source = Table.SelectRows(Excel.CurrentWorkbook(), each Text.StartsWith([Name],"tData201"))[Content],
 fxDates = (s as date,e as date)=>List.Dates(s, if(e>=s) then Duration.Days(e-s)+1 else 0, hashtag#duration(1,0,0,0)),
 B = Table.AddColumn(
 Table.TransformColumnTypes(Source{0},{{"Buy Date From", type date}, {"Buy Date To", type date}}),
 "Period", each fxDates([Buy Date From], [Buy Date To]) ),
 DMin = List.Min(B[#"Buy Date From"]),
 DMax = List.Max(B[#"Buy Date To"]),
 I = Table.AddColumn(
 Table.TransformColumnTypes(Source{1},{{"Stock Start Date", type date}, {"Stock Finish Date", type date}}),
 "Period", each fxDates([Stock Start Date]??DMin, [Stock Finish Date]??DMax) ),
 Transform = Table.TransformRows(B, each let
 B = [Buyer], BPeriod=[Period],
 Add_In = Table.AddColumn(I, "DaysIn", each List.Count(List.Intersect({[Period], BPeriod}))),
 R = List.Accumulate(Table.ToRecords(Add_In), [#"Buyer / Items" =B],
 (s,c)=>s & Record.FromList({if c[DaysIn]>0 then "x" else null}, {c[Items]}))
 in R),
 Result = Table.FromRecords(Transform)
in
 Result
Power Query solution 6 for Map Buyer Purchase Dates, proposed by Eric Laforce:
Short functional description of these main steps =

1) Add column to [Buyer] table with days list of buying period
2) Add column to [Item] table with days list of stock period. Having Min/Max of all buyers Period if 1 stock date is missing
3) For each buyer buid a record for all items with
 NbOfDaysInCommun of 2 periods buying & stock
4) Final Result = table from these calculated records
Power Query solution 7 for Map Buyer Purchase Dates, proposed by 🇮🇷 Navid Esmaeilzadeh اسماعیل زاده:
let
 S1 = Excel.CurrentWorkbook(){[Name="Table1"]}[Content],
 A = Table.TransformColumnTypes(S1,{{"Buyer", type text}, {"Buy Date From", type date}, {"Buy Date To", type date}}),
 MinDate = List.Min({List.Min(A[Buy Date From]),List.Min(A[Buy Date To])}),
 MaxDate = List.Max({List.Max(A[Buy Date From]),List.Max(A[Buy Date To])}),
 S2 = Excel.CurrentWorkbook(){[Name="Table2"]}[Content],
 B = Table.TransformColumnTypes(S2,{{"Stock Start Date", type date}, {"Stock Finish Date", type date}}),
 C = Table.AddColumn(B, "Date", each let
A=if [Stock Start Date]=null then MinDate else [Stock Start Date],
B=if [Stock Finish Date]=null then MaxDate else [Stock Finish Date],
C={Number.From(A)..Number.From(B)}
in
C),
 D = Table.ExpandListColumn(C, "Date"),
 E = Table.TransformColumnTypes(D,{{"Date", type date}}),
 #"B-A" = A,
 F = Table.AddColumn(#"B-A", "Date", each {Number.From([Buy Date From])..Number.From([Buy Date To])}),
 G = Table.ExpandListColumn(F, "Date"),
 H = Table.TransformColumnTypes(G,{{"Date", type date}}),
 I = Table.NestedJoin(H,{"Date"},E,{"Date"},"N"),
 J = Table.ExpandTableColumn(I, "N", {"Items"}, {"Items"}),
Power Query solution 8 for Map Buyer Purchase Dates, proposed by 🇮🇷 Navid Esmaeilzadeh اسماعیل زاده:
Part2:
 K = Table.Group(J, {"Buyer", "Items"}, {{"Count", each Table.RowCount(_), Int64.Type}}),
 L = Table.Sort(K,{{"Buyer", Order.Ascending}}),
 M = Table.AddColumn(L, "C", each "X"),
 N = Table.SelectColumns(M,{"Buyer", "Items", "C"}),
 Sol = Table.Pivot(N,List.Sort(List.Distinct(N[Items])), "Items", "C")
in
 Sol
Power Query solution 9 for Map Buyer Purchase Dates, proposed by Yaroslav Drohomyretskyi:
let
  Source = Excel.CurrentWorkbook(){[Name = "Table1"]}[Content],
  CrossJoin = Table.ExpandTableColumn(
    Table.AddColumn(Source, "Custom", each Excel.CurrentWorkbook(){[Name = "Table2"]}[Content]),
    "Custom",
    {"Items", "Stock Start Date", "Stock Finish Date"},
    {"Items", "Stock Start Date", "Stock Finish Date"}
  ),
  X = Table.AddColumn(
    CrossJoin,
    "X",
    each
      if [Stock Start Date] is null and [Stock Finish Date] is null then
        "X"
      else
        try

            if [Buy Date To] < [Stock Start Date] or [Buy Date From] > [Stock Finish Date] then
              null
            else
              "X"
        otherwise
          try
            if [Buy Date From] <= [Stock Finish Date] then "X" else null
          otherwise
            if [Buy Date To] > [Stock Start Date] then "X" else null
  ),
  Pivot = Table.Pivot(
    Table.SelectColumns(X, {"Buyer", "Items", "X"}),
    List.Distinct(X[Items]),
    "Items",
    "X"
  )
in
  Pivot
Power Query solution 10 for Map Buyer Purchase Dates, proposed by Sandeep Marwal:
let
 Source = Excel.CurrentWorkbook()[Content]{0},
 Ctype = Table.TransformColumnTypes(Source,{{"Buy Date From", type date}, {"Buy Date To", type date}}),
 S1 = Table.AddColumn(Ctype, "itemlist", each Itemtable[Items]),
 S2 = Table.ExpandListColumn(S1, "itemlist"),
 S3 = Table.NestedJoin(S2, {"itemlist"}, Itemtable, {"Items"}, "Item", JoinKind.LeftOuter),
 S4 = Table.ExpandTableColumn(S3, "Item", {"Stock Start Date", "Stock Finish Date"}, {"Item.Stock Start Date", "Item.Stock Finish Date"}),
 S5 = Table.AddColumn(S4,"listofdates",each List.Dates([Buy Date From],1+Duration.Days([Buy Date To]-[Buy Date From]),hashtag#duration(1, 0, 0, 0))),
 S6 = Table.AddColumn(S5,"test",(a)=> List.AnyTrue(List.Transform(a[listofdates],each _>=a[Item.Stock Start Date] and _<=a[Item.Stock Finish Date]))),
 S7 = Table.SelectColumns(S6,{"Buyer", "itemlist", "test"}),
 S8 = Table.TransformColumnTypes(S7,{{"test", type text}}),
 S9 = Table.ReplaceValue(S8,"false",null,Replacer.ReplaceValue,{"test"}),
 S10 = Table.ReplaceValue(S9,"true","X",Replacer.ReplaceText,{"test"}),
 S11 = Table.Pivot(S10, List.Distinct(S10[itemlist]), "itemlist", "test")
in
 S11
Power Query solution 11 for Map Buyer Purchase Dates, proposed by Sandeep Marwal:
let
 Source = Excel.CurrentWorkbook()[Content]{1},
 S1 = Table.ReplaceValue(Source,null,hashtag#datetime(1900, 1, 1, 0, 0, 0),Replacer.ReplaceValue,{"Stock Start Date"}),
 S2 = Table.ReplaceValue(S1,null,hashtag#datetime(2050, 12, 31, 0, 0, 0),Replacer.ReplaceValue,{"Stock Finish Date"}),
 S3 = Table.TransformColumnTypes(S2,{{"Items", type text}, {"Stock Start Date", type date}, {"Stock Finish Date", type date}})
in
 S3
Power Query solution 12 for Map Buyer Purchase Dates, proposed by Joevan Bedico:
let
  Source = Excel.CurrentWorkbook(){[Name = "Table1"]}[Content],
  ItemTbl = Table.TransformColumns(
    Excel.CurrentWorkbook(){[Name = "Table2"]}[Content],
    {
      {"Stock Start Date", each if _ = null then List.Min(Source[Buy Date From]) else _},
      {"Stock Finish Date", each if _ = null then List.Max(Source[Buy Date To]) else _}
    }
  ),
  Answer = Table.FromRows(
    List.Transform(
      Table.ToRows(Source),
      (b) => {b{0}}
        & List.Transform(
          Table.ToRows(ItemTbl),
          (i) =>
            if List.AnyTrue(List.Transform(List.Skip(b), each Duration.Days(_ - i{1}) >= 0))
              and List.AnyTrue(List.Transform(List.Skip(b), each Duration.Days(_ - i{2}) <= 0))
            then
              "X"
            else
              null
        )
    ),
    {"Buyer / Items"} & ItemTbl[Items]
  )
in
  Answer
Solving the challenge of Map Buyer Purchase Dates with Excel
Excel solution 1 for Map Buyer Purchase Dates, proposed by Bo Rydobon 🇹🇭:
=HSTACK(VSTACK(
    A2&" / "&A10,
    A3:A7
),
    TRANSPOSE(REDUCE(A11:A16,
    C3:C7,
    LAMBDA(a,
    v,
    HSTACK(a,
    REPT("X",
    (v>=B11:B16)*(@+v:B7<=IF(
        C11:C16,
        C11:C16,
        ""
    ))))))))
Excel solution 2 for Map Buyer Purchase Dates, proposed by محمد حلمي:
=REDUCE(E1:K1,
    C3:C7,
    LAMBDA(a,
    v,
    VSTACK(a,

HSTACK(@+v:A7,
    REPT("X",
    TOROW((IF(
        C11:C16,
        C11:C16,

        MAX(
            C3:C7
        )
    )>=@+v:B7)*(B11:B16<=v)))))))
Excel solution 3 for Map Buyer Purchase Dates, proposed by Kris Jaganah:
=LET(a,
    A3:A7,
    b,
    B3:B7,
    c,
    C3:C7,
    d,
    A11:A16,
    e,
    B11:B16,
    f,
    C11:C16,
    g,
    IF(
        e="",
        MIN(
            b
        ),
        e
    ),
    h,
    IF(
        f="",
        MAX(
            c
        ),
        f
    ),
    i,
    MAP(b,
    c,
    LAMBDA(x,
    y,
    ARRAYTOTEXT(FILTER(d,
    ((x>=g)*(y<=h))+(y>=g)*(x<=h))))),
    j,
    TOROW(
        d
    ),
    VSTACK(
        HSTACK(
            "Buyer / Items",
            j
        ),
        HSTACK(
            a,
            IF(
                ISERR(
                    FIND(
                        j,
                        i
                    )
                ),
                "",
                "X"
            )
        )
    ))
Excel solution 4 for Map Buyer Purchase Dates, proposed by Julian Poeltl:
=LET(B,
    B3:B7,
    BT,
    C3:C7,
    SF,
    C11:C16,
    D,
    BT-B,
    VSTACK(HSTACK(
        "Buyer / Items",
        TOROW(
            A11:A16
        )
    ),
    HSTACK(A3:A7,
    IF((TOROW(
        B11:B16
    )-D<=B)*(BT<=TOROW(
        IF(
            SF,
            SF,
            50000
        )
    )+D),
    "X",
    ""))))
Excel solution 5 for Map Buyer Purchase Dates, proposed by Julian Poeltl:
=LET(T,
    A3:C7,
    BD,
    CHOOSECOLS(
        T,
        2
    ),
    BDT,
    TAKE(
        T,
        ,
        -1
    ),
    TT,
    A11:C16,
    SF,
    TAKE(
        TT,
        ,
        -1
    ),
    D,
    BDT-BD,
    VSTACK(HSTACK(
        "Buyer / Items",
        TOROW(
            TAKE(
                TT,
                ,
                1
            )
        )
    ),
    HSTACK(TAKE(
        T,
        ,
        1
    ),
    IF((TOROW(
        CHOOSECOLS(
            TT,
            2
        )
    )-D<=BD)*(BDT<=TOROW(
        IF(
            SF,
            SF,
            50000
        )
    )+D),
    "X",
    ""))))
Excel solution 6 for Map Buyer Purchase Dates, proposed by Sunny Baggu:
=VSTACK(

     HSTACK(
         E1,
          TOROW(
              A11:A16
          )
     ),

     HSTACK(

          A3:A7,

          MAKEARRAY(

               ROWS(
                   A3:A7
               ),

               ROWS(
              A11:A16
          ),

               LAMBDA(
                   r,
                    c,

                    INDEX(

                         TOROW(

                              IF(

                                   MAP(

                                        IF(
                                            C11:C16,
                                             C1&1:C16,
                                             MAX(
                                                 C3:C7
                                             )
                                        ) >= INDEX(
                                            B3:B7,
                                             r
                                        ),

                                        INDEX(
                                            C3:C7,
                                             r
                                        ) >= B11:B16,

                                        LAMBDA(
                                            c,
                                             d,
                                             AND(
                                                 c,
                                                  d
                                             )
                                        )

                                   ),

                                   "X",

                                   ""

                              )

                         ),

                         c

                    )

               )

          )

     )

)
Excel solution 7 for Map Buyer Purchase Dates, proposed by LEONARD OCHEA 🇷🇴:
=LET(a,
    B3:B7,
    b,
    C3:C7,
    c,
    TOROW(
        B11:B16
    ),
    d,
    TOROW(
        C11:C16
    ),
    e,
    IF(
        d,
        d,
        MAX(
            b
        )
    ),
    v,
    A3:A7,
    h,
    TOROW(
        A11:A16
    ),
    w,
    A2&" / "&A10,
    HSTACK(VSTACK(
        w,
        v
    ),
     VSTACK(h,
    IF((a>=c)*(a<=e)+(b>=c)*(b<=e),
    "X",
    ""))))
For the beta channel,
     shorten with function names that are repeated more than once
=LET(F,
    TOROW,
    V,
    VSTACK,
    a,
    B3:B7,
    b,
    C3:C7,
    c,
    F(
        B11:B16
    ),
    d,
    F(
        C11:C16
    ),
    e,
    IF(
        d,
        d,
        MAX(
            b
        )
    ),
    h,
    F(
        A11:A16
    ),
    i,
    A3:A7,
    j,
    A2&" / "&A10,
    HSTACK(V(
        j,
        i
    ),
    V(h,
    IF((a>=c)*(a<=e)+(b>=c)*(b<=e),
    "X",
    ""))))
Excel solution 8 for Map Buyer Purchase Dates, proposed by Hamidi Hamid:
=HSTACK(
    E1:E6,
    VSTACK(
        TRANSPOSE(
            A11:A16
        ),
        LET(
            cl,
            A10:A16,
            y,
            XLOOKUP(
                TRANSPOSE(
            A11:A16
        ),
                cl,
                C10:C16,
                ""
            ),
            gn,
            IF(
                y="",
                DATE(
                    2024,
                    12,
                    31
                ),
                y
            ),
            x,
            XLOOKUP(
                TRANSPOSE(
            A11:A16
        ),
                cl,
                B10:B16,
                ""
            ),
            gh,
            IF(
                x="",
                DATE(
                    2024,
                    1,
                    1
                ),
                x
            ),
            IF(
                gnC3:C7,
                    "",
                    "X"
                )
            )
        )
    )
)
Excel solution 9 for Map Buyer Purchase Dates, proposed by ferhat CK:
=LET(a,
    DROP(REDUCE(0,
    B3:B7,
    LAMBDA(x,
    y,
    VSTACK(x,
    (y>=B11:B16)+(y<=C11:C16)))),
    1),
    b,
    DROP(REDUCE(0,
    C3:C7,
    LAMBDA(x,
    y,
    VSTACK(x,
    (y>=B11:B16)+(y<=IF(
        C11:C16="",
        100^3,
        C11:C16
    ))))),
    1),
    c,
    IF(
        WRAPROWS(
            a+b,
            6
        )>2,
        "X",
        ""
    ),
    HSTACK(
        A3:A7,
        c
    ))
Excel solution 10 for Map Buyer Purchase Dates, proposed by Imam Hambali:
=LET(
by,
     A3:A7,

it,
     A11:A16,

bf,
     B3:B7,

bt,
     C3:C7,

ss,
     B11:B16,

sf,
     IF(
         C11:C16="",
         "2050-01-01",
         C11:C16
     ),

dt,
     (bt*1>=TRANSPOSE(
         ss*1
     ))+(bf*1<=TRANSPOSE(
         sf*1
     )),

x,
     HSTACK(
         VSTACK(
             "Buyer / Items",
             by
         ),
         VSTACK(
             TRANSPOSE(
                 it
             ),
             IF(
                 dt=2,
                 "X",
                 ""
             )
         )
     ),

x
)
Excel solution 11 for Map Buyer Purchase Dates, proposed by El Badlis Mohd Marzudin:
=LET(i,
    A11:A16,
    a,
    B3:B7,
    b,
    C3:C7,
    c,
    B11:B16,
    d,
    C11:C16,
    e,
    IF(
        c="",
        1,
        c
    ),
    f,
    IF(
        d="",
        50000,
        d
    ),
    g,
    MAP(a,
    b,
     LAMBDA(x,
    y,
    TEXTJOIN(" ",
    ,
    FILTER(i,
    ((x<=e)*(y>=f))+((x>=e)*(y<=f)+((x<=f)*(y>=e))))))),
    VSTACK(
        HSTACK(
            "Buyer / Items",
            TOROW(
                i
            )
        ),
        HSTACK(
            A3:A7,
            IF(
                ISNUMBER(
                    SEARCH(
                        TOROW(
                i
            ),
                        g
                    )
                ),
                "X",
                ""
            )
        )
    ))
Solving the challenge of Map Buyer Purchase Dates with Python
Python solution 1 for Map Buyer Purchase Dates, proposed by Konrad Gryczan, PhD:
import pandas as pd
path = "PQ_Challenge_201.xlsx"
input1 = pd.read_excel(path, usecols="A:C", skiprows=1, nrows = 5)
input2 = pd.read_excel(path, usecols="A:C", skiprows=9, nrows = 6)
test = pd.read_excel(path, usecols="E:K", nrows = 5)
i1 = input1.assign(date=input1.apply(lambda row: pd.date_range(row['Buy Date From'], row['Buy Date To'], freq='D'), axis=1))
 .explode('date')
 .filter(['Buyer', 'date'])
i2 = input2.assign(**{
 'Stock Start Date': input2['Stock Start Date'].fillna(input2['Stock Start Date'].min()),
 'Stock Finish Date': input2['Stock Finish Date'].fillna(i1['date'].max())
 })
i2['date'] = i2.apply(lambda row: pd.date_range(row['Stock Start Date'], row['Stock Finish Date'], freq='D'), axis=1)
i2 = i2.explode('date').filter(['Items', 'date'])
result = pd.merge(i1, i2, on='date')
 .assign(X='X')
 .pivot_table(index='Buyer', columns='Items', values='X', aggfunc='first')
 .reset_index()
 .rename(columns={'Buyer': 'Buyer / Items'})
 .rename_axis(None, axis=1)

print(result.equals(test))  # True
Solving the challenge of Map Buyer Purchase Dates with Python in Excel
Python in Excel solution 1 for Map Buyer Purchase Dates, proposed by Abdallah Ally:
from itertools import product
df1 = xl("A2:C7", headers=True)
df2 = xl("A10:C16", headers=True)
# Perform data munging
minimum = df1.iloc[:, 1:].values.min()
maximun = df1.iloc[:, 1:].values.max()
df2.iloc[:, 1] = df2.iloc[:, 1].fillna(minimum)
df2.iloc[:, 2] = df2.iloc[:, 2].fillna(maximun)
df1 = df1.set_index(keys='Buyer')
df2 = df2.set_index(keys='Items')
df = pd.DataFrame(data=list(df1.index), columns=['Buyer / Items'])
for item in df2.index:
 df[item] = ''
for item, buyer in product(df2.index, df1.index):
 buy = pd.date_range(df1.at[buyer, 'Buy Date From'], df1.at[buyer, 'Buy Date To'])
 stock = pd.date_range(df2.at[item, 'Stock Start Date'], df2.at[item, 'Stock Finish Date'])
 if any([x in stock for x in buy]):
 df[item][df['Buyer / Items'] == buyer] = 'X'
df
Solving the challenge of Map Buyer Purchase Dates with R
R solution 1 for Map Buyer Purchase Dates, proposed by Konrad Gryczan, PhD:
library(tidyverse)
library(readxl)
path = "Power Query/PQ_Challenge_201.xlsx"
input1 = read_excel(path, range = "A2:C7")
input2 = read_excel(path, range = "A10:C16")
test = read_excel(path, range = "E1:K6")
i1 = input1 %>%
 mutate(date = map2(`Buy Date From`, `Buy Date To`, seq, by = "day")) %>%
 unnest(date) %>%
 select(Buyer, date)
i2 = input2 %>%
 mutate(`Stock Start Date` = replace_na(`Stock Start Date`, min(`Stock Start Date`, na.rm = TRUE)),
 `Stock Finish Date` = replace_na(`Stock Finish Date`, max(i1$date, na.rm = TRUE))) %>%
 mutate(date = map2(`Stock Start Date`, `Stock Finish Date`, seq, by = "day")) %>%
 unnest(date) %>%
 select(Items, date)
result = i1 %>%
 inner_join(i2, by = c("date")) %>%
 pivot_wider(names_from = Items, values_from = date, values_fn = length) %>%
 select(`Buyer / Items` = 1, sort(colnames(.), decreasing = FALSE)) %>%
 mutate(across(-c(1), ~ifelse(is.na(.), ., "X")))
all.equal(result, test)
# [1] TRUE
R solution 2 for Map Buyer Purchase Dates, proposed by Anil Kumar Goyal:
library(tidyverse)
library(readxl)
df <- read_excel("PQ/PQ_Challenge_201.xlsx",
 range = "A2:C7") |>
 janitor::clean_names()
stock <- read_excel("PQ/PQ_Challenge_201.xlsx",
 range = "A10:C16") |>
 janitor::clean_names()
df |>
 left_join(
 stock |>
 replace_na(list(
 stock_start_date = min(df[[2]], df[[3]]),
 stock_finish_date = max(df[[2]], df[[3]])
 )),
 by = join_by(
 overlaps(buy_date_from, buy_date_to, stock_start_date, stock_finish_date)
 )
 ) |>
 mutate(val = "X") |>
 pivot_wider(id_cols = buyer, names_from = items, values_from = val, names_sort = TRUE)
&&