
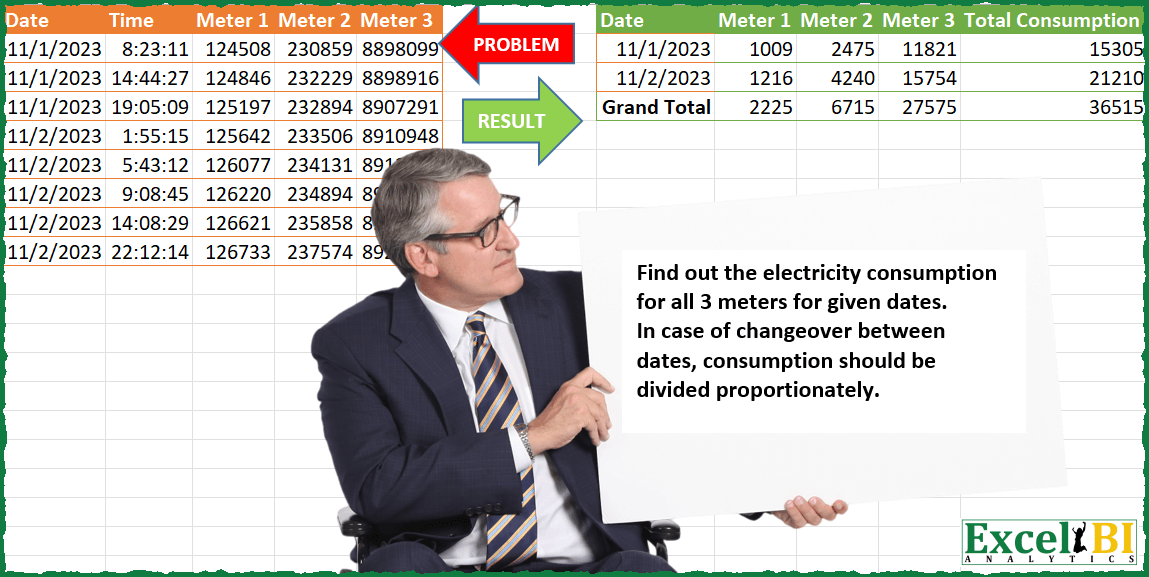
Find out the electricity consumption for all 3 meters for given dates. In case of changeover between dates, consumption should be divided proportionately (as per time used). For ex. for Meter 1 On 1-Nov-23, total consumption is 125197-124508 = 689 Between 1-Nov-23 19:05:09 and 2-Nov-23 1:55:15, consumption is 445. Dividing consumption proportionately, 1-Nov-23 consumption between 19:05:09 and 12 midnight is 320 units and 2-Nov-23 consumption between 12 midnight and 1:55:15 is 125 units. Hence consumption on 1-Nov-23 = 689+320 = 1009
📌 Challenge Details and Links
ExcelBI Power Query Challenge Number: 133
Challenge Difficulty: ⭐️⭐️⭐️⭐️⭐️⭐️
📥Download Sample File
📥Link to the solutions on LinkedIn
Solving the challenge of Meter Reading Consumption Split with Power Query
Power Query solution 1 for Meter Reading Consumption Split, proposed by Zoran Milokanović:
let
  Source = Excel.CurrentWorkbook(){[Name = "Input"]}[Content],
  U = Table.Sort(
    Table.UnpivotOtherColumns(Source, {"Date", "Time"}, "A", "V"),
    {"A", "Date", "Time"}
  ),
  P = Table.Group(
    Table.FromRows(
      List.Accumulate(
        Table.ToRows(U),
        {},
        (s, c) =>
          let
            l = List.Last(s),
            e = c{3} - l{3},
            x = Number.Round((e / (1 - l{1} + c{1})) * (1 - l{1}))
          in
            s
              & (
                if s = {} or c{2} <> l{2} or c{0} = l{0} then
                  {}
                else
                  {{l{0}, null, l{2}, l{3} + x}, {c{0}, null, c{2}, c{3} - e + x}}
              )
              & {c}
      ),
      Table.ColumnNames(U)
    ),
    {"Date", "A"},
    {{"V", each List.Max([V]) - List.Min([V])}}
  ),
  S = Table.AddColumn(
    Table.Pivot(
      P & Table.Group(P, {"A"}, {{"V", each List.Sum([V])}, {"Date", each "Grand Total"}}),
      List.Distinct(P[A]),
      "A",
      "V",
      List.Sum
    ),
    "Total Consumption",
    each List.Sum(List.Skip(Record.ToList(_)))
  )
in
  S
Power Query solution 2 for Meter Reading Consumption Split, proposed by Alejandro Simón 🇵🇦 🇪🇸:
let
 Source = Excel.CurrentWorkbook(){[Name="Table1"]}[Content],
 Unpivot = Table.UnpivotOtherColumns(Source, {"Date", "Time"}, "Attribute", "Value"),
 Group = Table.Combine(Table.Group(Unpivot, {"Attribute"}, {{"All", each
let
a = Table.AddIndexColumn(_, "Idx",1),
b = Table.AddIndexColumn(_, "Idx"),
c = Table.NestedJoin(a, {"Idx"}, b, {"Idx"}, "A", JoinKind.FullOuter),
d = Table.Sort(Table.ExpandTableColumn(c, "A", {"Date", "Time", "Value"}, {"Date1", "Time1", "Value1"}), "Idx"),
e = Table.SelectRows(Table.AddColumn(d, "A", each
 let
 u = try
 if d[Date]{[Idx]-1} = null then [Value1]-[Value] else
 if d[Date]{[Idx]-1} = d[Date]{[Idx]} and [Date] = [Date1] then [Value1]-[Value] else
 if d[Date]{[Idx]-1} = d[Date]{[Idx]} and [Date] <> [Date1] then Number.Round(([Value1]-[Value])/(1-[Time]+[Time1])*(1-[Time]),0) else
 [Value1]-[Value] + Number.Round((d[Value1]{[Idx]-1}- d[Value]{[Idx]-1})/(1-d[Time]{[Idx]-1}+d[Time1]{[Idx]-1})*d[Time1]{[Idx]-1}, 0)
 otherwise [Value1]-[Value] in u), each [Date]<>null and [Date1]<>null),
f = Table.SelectColumns(e, {"Date", "Attribute", "A"})
in f}})[All]),
Solving the challenge of Meter Reading Consumption Split with Excel
Excel solution 1 for Meter Reading Consumption Split, proposed by Bo Rydobon 🇹🇭:
=LET(a,A2:A9,o,{1;0},u,UNIQUE(a),v,DROP(u,1),L,LAMBDA(y,MAP(XMATCH(v,a),LAMBDA(x,TREND(CHOOSEROWS(y,x-o),INDEX(a+B2:B9,x-o),INDEX(a,x))))),w,VSTACK(HSTACK(L(C2:C9),L(D2:D9),L(E2:E9)),C2:E9),x,VSTACK(v,a),y,CHOOSEROWS(w,IFNA(XMATCH(u+1,x),ROWS(x)))-CHOOSEROWS(w,XMATCH(u,x)),z,VSTACK(y,BYCOL(y,LAMBDA(i,SUM(i)))),VSTACK(HSTACK(A1,C1:E1,"Total Consumption"),HSTACK(VSTACK(u,"Grand Total"),z,BYROW(z,LAMBDA(i,SUM(i))))))Excel solution 2 for Meter Reading Consumption Split, proposed by Bo Rydobon 🇹🇭:
=LET(a,A2:A9,m,C2:E9,o,{1;0},
u,UNIQUE(a),v,DROP(u,1),L,LAMBDA(y,MAP(XMATCH(v,a),LAMBDA(x,TREND(CHOOSEROWS(y,x-o),INDEX(a+B2:B9,x-o),INDEX(a,x))))),
d,DROP(REDUCE(0,SEQUENCE(COLUMNS(m)),LAMBDA(c,n,HSTACK(c,L(INDEX(m,,n))))),,1),
g,GROUPBY(VSTACK(A1,a,DROP(u,1),DROP(u,-1)),VSTACK(C1:E1,m,d,d),LAMBDA(x,MAX(x)-MIN(x)),3,1),t,BYROW(g,SUM),
HSTACK(IF(g="Total","Grand "&g,g),IF(t,t,"Total Consumption")))
Excel solution 3 for Meter Reading Consumption Split, proposed by محمد حلمي:
=LET(c,A2:A9,b,B2:B9,m,C2:E9,e,REDUCE(HSTACK(A1,
C1:E1,"Total Consumption"),UNIQUE(c),LAMBDA(a,d,
LET(r,LAMBDA(w,[z],[q],XLOOKUP(d+z,c,w,,,q)),
i,r(b),
z,r(b,1),
e,r(b,,-1),
p,r(b,-1,-1),
g,r(m),
y,r(m,1),
v,r(m,,-1),
k,r(m,-1,-1),
s,v-g+ROUND(
IFNA((y-v)/(1+z-e)*(1-e),)+IFNA(i*(g-k)/(1+i-p),),),
VSTACK(a,HSTACK(d,s,SUM(s)))))),
VSTACK(e,HSTACK("Grand Total",
BYCOL(DROP(e,,1),LAMBDA(a,SUM(a))))))
Excel solution 4 for Meter Reading Consumption Split, proposed by Edwin Tisnado:
=LET(a,A2:E4,b,A5:E9,m,DROP(a,2,2),n,DROP(a,-2,2),o,DROP(b,4,2),p,DROP(b,-4,2),h,"24:00:00"-TAKE(CHOOSECOLS(a,2),-1),r,TAKE(CHOOSECOLS(b,2),1),l,ROUND(h/(h+r)*(p-m),0),i,ROUND(r/(h+r)*(p-m),0),VSTACK({"Date","Meter 1","Meter 2","Meter 3","Total Consumption"},HSTACK(VSTACK(TAKE(a,1,1),TAKE(b,1,1),"Grand Total"),VSTACK(m-n+l,o-p+i,m-n+l+o-p+i),VSTACK(SUM(m-n+l),SUM(o-p+i),SUM(m-n+l+o-p+i)))))Solving the challenge of Meter Reading Consumption Split with R
R solution 1 for Meter Reading Consumption Split, proposed by Konrad Gryczan, PhD:
library(tidyverse)
library(readxl)
library(lubridate)
input = read_excel("PQ_Challenge_133.xlsx", range = "A1:E9", col_types = c("date", "date", "numeric", "numeric", "numeric"))
test = read_excel("PQ_Challenge_133.xlsx", range = "G1:J3")
df = input %>%
 mutate(Time = Time + years(124) - days(ifelse(day(Date) == 1, 60, 59))) %>%
 select(-Date) %>%
 pivot_longer(-Time, names_to = "Meter", values_to = "Value") %>%
 group_by(Meter) %>%
 arrange(Meter, Time) %>%
 mutate(end = lead(Time),
 next_reading = lead(Value),
 cross_midnight = ifelse(day(Time) != day(end), 1, 0),
 duration = end-Time,
 consumption = next_reading - Value ,
 time_to_midnight = difftime( ceiling_date(Time, "day"),Time, units = "hours"))
 )
to be continued...
&&&