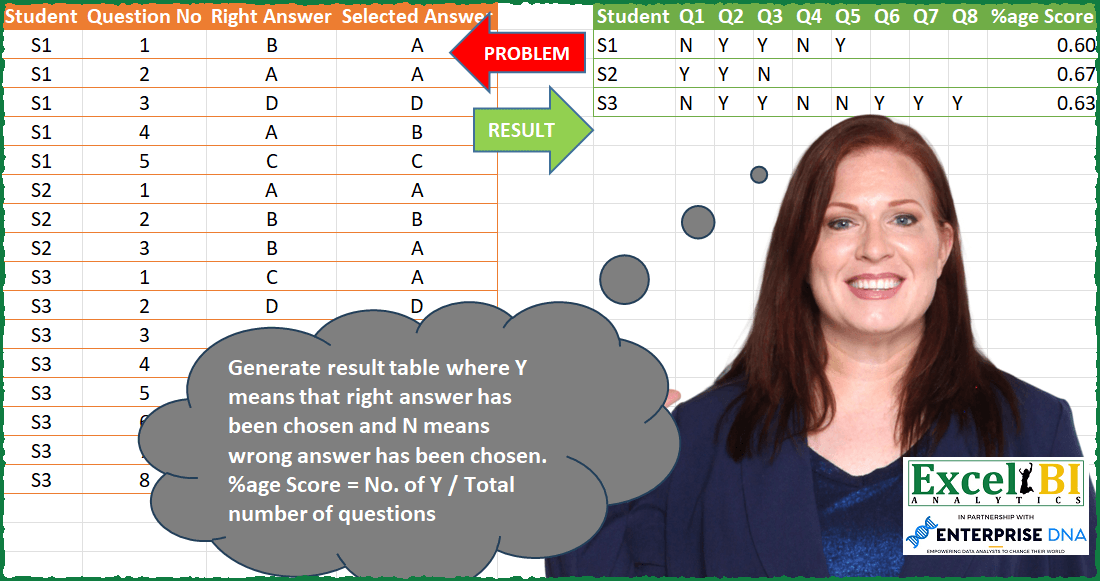
Generate result table where Y means that right answer has been chosen and N means wrong answer has been chosen. %age Score = No. of Y / Total number of questions
📌 Challenge Details and Links
ExcelBI Power Query Challenge Number: 83
Challenge Difficulty: ⭐️⭐️
📥Download Sample File
📥Link to the solutions on LinkedIn
Solving the challenge of Calculate Percentage of Correct Answers with Power Query
Power Query solution 1 for Calculate Percentage of Correct Answers, proposed by Bo Rydobon 🇹🇭:
let
  Source = Excel.CurrentWorkbook(){[Name = "Table1"]}[Content],
  Group = Table.ExpandRecordColumn(
    Table.Group(
      Source,
      "Student",
      {
        "T",
        each
          let
            y = Table.AddColumn(
              _,
              "Y",
              each if [Right Answer] = [Selected Answer] then "Y" else "N"
            )[Y]
          in
            Record.FromList(y, List.Transform([Question No], each "Q" & Text.From(_)))
      }
    ),
    "T",
    List.Transform(List.Distinct(Source[Question No]), each "Q" & Text.From(_))
  ),
  APerc = Table.AddColumn(
    Group,
    "%age Score",
    each
      let
        r = Record.ToList(_)
      in
        List.Count(List.Select(r, each _ = "Y")) / (List.NonNullCount(r) - 1)
  )
in
  APerc
Power Query solution 2 for Calculate Percentage of Correct Answers, proposed by Zoran Milokanović:
let
  Source = Excel.CurrentWorkbook(){[Name = "Input"]}[Content],
  Adjust = Table.CombineColumns(
    Table.TransformColumns(Source, {"Question No", each "Q" & Text.From(_)}),
    {"Right Answer", "Selected Answer"},
    each if List.Count(List.Distinct(_)) = 1 then "Y" else "N",
    "V"
  ),
  Solution = Table.AddColumn(
    Table.Pivot(Adjust, List.Distinct(Adjust[#"Question No"]), "Question No", "V"),
    "%age Score",
    each
      let
        l = List.RemoveNulls(List.Skip(Record.ToList(_)))
      in
        Number.RoundUp(List.Count(List.Select(l, each _ = "Y")) / List.Count(l), 2)
  )
in
  Solution
Power Query solution 3 for Calculate Percentage of Correct Answers, proposed by Kris Jaganah:
let
  Source = Excel.CurrentWorkbook(){[Name = "Table1"]}[Content],
  #"Correct" = Table.AddColumn(
    Source,
    "Correct",
    each if [Right Answer] = [Selected Answer] then 1 else 0
  ),
  #"Grouped" = Table.Group(
    #"Correct",
    {"Student"},
    {
      {
        "Count",
        each _,
        type table [
          Student = text,
          Question No = number,
          Right Answer = text,
          Selected Answer = text,
          Correct = number
        ]
      },
      {"%age Score", each List.Sum([Correct]) / List.Max([Question No]), type number}
    }
  ),
  #"Expanded Count" = Table.ExpandTableColumn(
    Grouped,
    "Count",
    {"Question No", "Correct"},
    {"C.Question No", "C.Correct"}
  ),
  #"Y/N" = Table.AddColumn(#"Expanded Count", "Y/N", each if [C.Correct] = 1 then "Y" else "N"),
  #"Q" = Table.AddColumn(#"Y/N", "Question", each "Q" & Text.From([C.Question No])),
  #"Removed" = Table.RemoveColumns(Q, {"C.Question No", "C.Correct"}),
  #"Pivot" = Table.Pivot(
    #"Removed",
    List.Distinct(#"Removed"[Question]),
    "Question",
    "Y/N",
    List.Max
  ),
  #"Reordered" = Table.ReorderColumns(
    Pivot,
    {"Student", "Q1", "Q2", "Q3", "Q4", "Q5", "Q6", "Q7", "Q8", "%age Score"}
  )
in
  #"Reordered"
Power Query solution 4 for Calculate Percentage of Correct Answers, proposed by Alejandro Simón 🇵🇦 🇪🇸:
let
  Source = Excel.CurrentWorkbook(){[Name = "Table1"]}[Content],
  Ans = Table.AddColumn(
    Source,
    "Custom",
    each if [Right Answer] = [Selected Answer] then "Y" else "N"
  ),
  Q = Table.RemoveColumns(
    Table.TransformColumns(Ans, {"Question No", each "Q" & Text.From(_)}),
    {"Right Answer", "Selected Answer"}
  ),
  Pivot = Table.Pivot(Q, List.Distinct(Q[#"Question No"]), "Question No", "Custom"),
  Sol = Table.AddColumn(
    Pivot,
    "%age Score",
    each
      let
        a = List.Skip(Record.ToList(_)),
        b = List.Count(List.RemoveNulls(a)),
        c = Number.Round(List.Count(List.Select(a, each _ = "Y")) / b, 2, 2)
      in
        c
  )
in
  Sol
Power Query solution 5 for Calculate Percentage of Correct Answers, proposed by Luan Rodrigues:
let
  Fonte = Tabela1,
  gp = Table.Group(
    Fonte,
    {"Student"},
    {
      {
        "Contagem",
        each Table.AddColumn(
          _,
          "Cond",
          each if [Right Answer] = [Selected Answer] then "Y" else "N"
        )
      }
    }
  ),
  exp = Table.ExpandTableColumn(gp, "Contagem", {"Question No", "Cond"}),
  sub = Table.ReplaceValue(
    exp,
    each [Question No],
    each "Q" & Text.From([Question No]),
    Replacer.ReplaceValue,
    {"Question No"}
  ),
  pv = Table.Pivot(sub, List.Distinct(sub[#"Question No"]), "Question No", "Cond"),
  res = Table.AddColumn(
    pv,
    "Personalizar",
    each Number.RoundUp(
      List.Count(
        List.Select(List.RemoveNulls(List.RemoveFirstN(Record.FieldValues(_), 1)), each _ = "Y")
      )
        / List.Count(List.RemoveNulls(List.RemoveFirstN(Record.FieldValues(_), 1))),
      2
    )
  )
in
  res
Power Query solution 6 for Calculate Percentage of Correct Answers, proposed by Eric Laforce:
let
  Source = Excel.CurrentWorkbook(){[Name = "tData83"]}[Content],
  Transform =
    let
      _tr = Table.TransformRows(
        Source,
        each [
          Student = [Student],
          Q       = "Q" & Text.From([Question No]),
          V       = if ([Selected Answer] = [Right Answer]) then "Y" else "N"
        ]
      )
    in
      Table.FromRecords(_tr),
  Group = Table.Group(
    Transform,
    "Student",
    {"Data", each Table.Pivot(_, List.Distinct(_[Q]), "Q", "V")}
  ),
  Expand = Table.ExpandTableColumn(Group, "Data", List.Distinct(Transform[Q])),
  Add_Score = Table.AddColumn(
    Expand,
    "Score",
    each
      let
        _lv    = List.Skip(Record.FieldValues(_)),
        _Score = List.Count(List.FindText(_lv, "Y")) / List.NonNullCount(_lv)
      in
        Number.Round(_Score, 2)
  )
in
  Add_Score
Power Query solution 7 for Calculate Percentage of Correct Answers, proposed by Matthias Friedmann:
let
  Source = Excel.CurrentWorkbook(){[Name = "Answers"]}[Content],
  #"Added Correct" = Table.AddColumn(
    Source,
    "Custom",
    each if [Right Answer] = [Selected Answer] then "Y" else "N"
  ),
  #"Added Prefix" = Table.TransformColumns(
    #"Added Correct",
    {{"Question No", each "Q" & Text.From(_, "de-DE"), type text}}
  ),
  #"Removed Columns" = Table.RemoveColumns(#"Added Prefix", {"Right Answer", "Selected Answer"}),
  #"Pivoted Column" = Table.Pivot(
    #"Removed Columns",
    List.Distinct(#"Removed Columns"[#"Question No"]),
    "Question No",
    "Custom"
  ),
  #"Added Score" = Table.AddColumn(
    #"Pivoted Column",
    "%age Score",
    each
      let
        a = List.Skip(Record.ToList(_))
      in
        List.Count(List.Select(a, each _ = "Y")) / List.NonNullCount(a),
    Percentage.Type
  )
in
  #"Added Score"
Power Query solution 8 for Calculate Percentage of Correct Answers, proposed by Victor Wang:
let
  Source = Excel.CurrentWorkbook(){[Name = "Table1"]}[Content],
  transformRows = Table.FromRecords(
    Table.TransformRows(
      Source,
      each [
        Student     = [Student],
        Question No = "Q" & Text.From([Question No]),
        pivotCol    = if [Right Answer] = [Selected Answer] then "Y" else "N"
      ]
    )
  ),
  Pivot = Table.Pivot(
    transformRows,
    List.Distinct(transformRows[#"Question No"]),
    "Question No",
    "pivotCol"
  ),
  percentY = Table.AddColumn(
    Pivot,
    "%age Score",
    each [
      l       = List.Skip(Record.ToList(_)),
      count   = List.NonNullCount(l),
      countY  = List.Count(List.Select(l, each _ = "Y")),
      percent = countY / count
    ][percent]
  )
in
  percentY
Power Query solution 9 for Calculate Percentage of Correct Answers, proposed by Sandeep Marwal:
let
  Source = Excel.CurrentWorkbook(){[Name = "Table1"]}[Content],
  #"Added Custom" = Table.AddColumn(
    Source,
    "Custom",
    each if [Right Answer] = [Selected Answer] then "Y" else "N"
  ),
  #"Removed Columns" = Table.RemoveColumns(#"Added Custom", {"Right Answer", "Selected Answer"}),
  #"Added Prefix" = Table.TransformColumns(
    #"Removed Columns",
    {{"Question No", each "Q" & Text.From(_, "en-IN"), type text}}
  ),
  #"Pivoted Column" = Table.Pivot(
    #"Added Prefix",
    List.Distinct(#"Added Prefix"[#"Question No"]),
    "Question No",
    "Custom"
  ),
  #"Added Custom1" = Table.AddColumn(
    #"Pivoted Column",
    "%age Score",
    each
      let
        a = List.Skip(List.RemoveNulls(Record.ToList(_)))
      in
        List.Count(List.Select(a, each _ = "Y")) / List.Count(a)
  ),
  #"Rounded Off" = Table.TransformColumns(
    #"Added Custom1",
    {{"%age Score", each Number.Round(_, 2, RoundingMode.AwayFromZero), type number}}
  )
in
  #"Rounded Off"
Power Query solution 10 for Calculate Percentage of Correct Answers, proposed by Mohand Tahar IGGUI:
let
  Source = Excel.CurrentWorkbook(){[Name = "Tableau1"]}[Content],
  #"Type modifié" = Table.TransformColumnTypes(
    Source,
    {
      {"Student", type text},
      {"Question No", type text},
      {"Right Answer", type text},
      {"Selected Answer", type text}
    }
  ),
  #"Colonne conditionnelle ajoutée" = Table.AddColumn(
    #"Type modifié",
    "Personnalisé",
    each if [Right Answer] = [Selected Answer] then "Y" else "N"
  ),
  #"Personnalisée ajoutée" = Table.AddColumn(
    #"Colonne conditionnelle ajoutée",
    "Questions",
    each "Q" & [Question No]
  ),
  #"Autres colonnes supprimées" = Table.SelectColumns(
    #"Personnalisée ajoutée",
    {"Student", "Questions", "Personnalisé"}
  ),
  #"Colonne dynamique" = Table.Pivot(
    #"Autres colonnes supprimées",
    List.Distinct(#"Autres colonnes supprimées"[Questions]),
    "Questions",
    "Personnalisé",
    List.Max
  ),
  #"Personnalisée ajoutée1" = Table.AddColumn(
    #"Colonne dynamique",
    "% Score",
    each (
      (if [Q1] = "Y" then 1 else 0)
        + (if [Q2] = "Y" then 1 else 0)
        + (if [Q3] = "Y" then 1 else 0)
        + (if [Q4] = "Y" then 1 else 0)
        + (if [Q5] = "Y" then 1 else 0)
        + (if [Q6] = "Y" then 1 else 0)
        + (if [Q7] = "Y" then 1 else 0)
        + (if [Q8] = "Y" then 1 else 0)
    )
      / (
        8
          - (
            (if [Q1] = null then 1 else 0)
              + (if [Q2] = null then 1 else 0)
              + (if [Q3] = null then 1 else 0)
              + (if [Q4] = null then 1 else 0)
              + (if [Q5] = null then 1 else 0)
              + (if [Q6] = null then 1 else 0)
              + (if [Q7] = null then 1 else 0)
              + (if [Q8] = null then 1 else 0)
          )
      )
  ),
  #"Type modifié1" = Table.TransformColumnTypes(
    #"Personnalisée ajoutée1",
    {{"% Score", Currency.Type}}
  )
in
  #"Type modifié1"
Solving the challenge of Calculate Percentage of Correct Answers with Excel
Excel solution 1 for Calculate Percentage of Correct Answers, proposed by Bo Rydobon 🇹🇭:
=LET(z,A2:D17,a,TAKE(z,,1),u,UNIQUE(a),q,UNIQUE(INDEX(z,,2)),y,TEXTSPLIT(CONCAT(IF(INDEX(z,,3)=DROP(z,,3),"Y","N")&N(a=DROP(VSTACK(a,0),1))),1,0,1,,""),
VSTACK(HSTACK(A1,"Q"&TOROW(q),"%age Score"),HSTACK(u,y,MMULT((y="Y")/COUNTIF(a,u),q^0))))
Excel solution 2 for Calculate Percentage of Correct Answers, proposed by Rick Rothstein:
=LET(a,A2:A17,g,DROP(REDUCE("",UNIQUE(a),LAMBDA(c,u,LET(s,TOROW(FILTER(IF(C2:C17=D2:D17,"Y","N"),a=u)),IFERROR(VSTACK(c,HSTACK(u,s)),"")))),1),VSTACK(HSTACK("Student","Q"&SEQUENCE(,MAX(B2:B17)),"%age Score"),HSTACK(g,BYROW(g,LAMBDA(r,COUNTA(FILTER(r,r="Y"))/COUNTA(FILTER(r,(r="Y")+(r="N"))))))))Excel solution 3 for Calculate Percentage of Correct Answers, proposed by محمد حلمي:
=LET(a,A2:A17,b,B2:B17,r,UNIQUE(a),d,UNIQUE(b),e,TOROW(d),i,XLOOKUP(r&e,a&b,IF(C2:C17=D2:D17,"Y","N"),""),VSTACK(HSTACK(A1,"Q"&e,"%age Score"),HSTACK(r,i,MMULT(--(i="Y"),d^0)/COUNTIF(a,r))))Excel solution 4 for Calculate Percentage of Correct Answers, proposed by محمد حلمي:
=LET(a,A2:A17,b,B2:B17,r,UNIQUE(a),e,TOROW(UNIQUE(b)),VSTACK(HSTACK(A1,"Q"&e),HSTACK(r,XLOOKUP(r&e,a&b,IF(C2:C17=D2:D17,"Y","N"),""))))Excel solution 5 for Calculate Percentage of Correct Answers, proposed by 🇰🇷 Taeyong Shin:
=LET(F,LAMBDA(x,y,IF(C2:C17=D2:D17,x,y)),pv,PIVOTBY(A2:A17,"Q"&B2:B17,F("Y","N"),SINGLE,,0,,0),HSTACK(pv,DROP(GROUPBY(A1:A17,VSTACK(O1,F(1,0)),LAMBDA(x,SUM(x)/ROWS(x)),3,0),,1)))Excel solution 6 for Calculate Percentage of Correct Answers, proposed by Kris Jaganah:
=LET(a,A2:A17,b,B2:B17,c,C2:C17,d,D2:D17,e,UNIQUE(a),f,TOROW("Q"&UNIQUE(b)),g,MAP(e,LAMBDA(x,SUM((a=x)*(c=d))/MAX(IF(a=x,b,"")))),h,IFNA(DROP(TRANSPOSE(REDUCE("",e,LAMBDA(x,y,HSTACK(x,FILTER(IF(c=d,"Y","N"),y=a))))),1),""),VSTACK(HSTACK("Student",f,"%age Score"),HSTACK(e,h,g)))Excel solution 7 for Calculate Percentage of Correct Answers, proposed by Oscar Mendez Roca Farell:
=LET(_u, UNIQUE(A2:A17),_n, MAX(B2:B17),_m, MAKEARRAY(ROWS(_u),_n, LAMBDA(r, c, IFERROR(INDEX(FILTER(--(C2:C17=D2:D17), A2:A17="S"&r), c),""))), VSTACK(HSTACK("Student","Q"&SECUENCIA(,_n),"%age Score"), HSTACK(_u, IFERROR(IF(_m,"Y","N"),""), BYROW(_m, LAMBDA(i, SUM(i)/COUNT(i))))))Excel solution 8 for Calculate Percentage of Correct Answers, proposed by Duy Tùng:
=LET(a,PIVOTBY(A2:A17,"Q"&B2:B17,IF(C2:C17=D2:D17,"Y","N"),SINGLE,,0,,0),b,DROP(a,1,1),HSTACK(IF(TAKE(a,1)&TAKE(a,,1)="",A1,a),VSTACK("%age Score",BYROW(N(b="y"),SUM)/BYROW(N(b>""),SUM))))Excel solution 9 for Calculate Percentage of Correct Answers, proposed by Sunny Baggu:
=LET(
 _stud, A2:A17,
 _uniq, UNIQUE(_stud),
 HSTACK(
 _uniq,
 XLOOKUP(
 _uniq & MAKEARRAY(ROWS(_uniq), MAX(B2:B17), LAMBDA(r, c, c)),
 _stud & B2:B17,
 IF(C2:C17 = D2:D17, "Y", "N"),
 ""
 ),
 LET(
 _Nr, MAP(_uniq, LAMBDA(a, SUM((C2:C17 = D2:D17) * (_stud = a)))),
 _tot, MAP(_uniq, LAMBDA(a, ROWS(FILTER(_stud, _stud = a)))),
 ROUND(_Nr / _tot, 2)
 )
 )
)
Excel solution 10 for Calculate Percentage of Correct Answers, proposed by Sunny Baggu:
=LET(
 _ustudent, UNIQUE(A2:A17),
 _res, IFNA(
 DROP(
 REDUCE(
 "",
 _ustudent,
 LAMBDA(a, v,
 VSTACK(a, TOROW(FILTER(IF(C2:C17 = D2:D17, "Y", "N"), A2:A17 = v)))
 )
 ),
 1
 ),
 ""
 ),
 _val, MAKEARRAY(
 ROWS(_res),
 1,
 LAMBDA(r, c,
 SUM(N(CHOOSEROWS(_&res, r) = "Y")) / SUM(N(CHOOSEROWS(_res, r) <> ""))
 )
 ),
 HSTACK(_ustudent, _res, ROUND(_val, 2))
)
Excel solution 11 for Calculate Percentage of Correct Answers, proposed by Sunny Baggu:
=LET(
 _ustud, UNIQUE(A2:A17),
 _tbl, IFERROR(
 MAKEARRAY(
 ROWS(_ustud),
 MAX(B2:B17),
 LAMBDA(r, c,
 INDEX(
 TOROW(
 FILTER(
 IF(C2:C17 = D2:D17, "Y", "N"),
 A2:A17 = INDEX(_ustud, r),
 ""
 )
 ),
 c
 )
 )
 ),
 ""
 ),
 _Nr, BYROW(MAP(_tbl, LAMBDA(a, N(a = "Y"))), LAMBDA(b, SUM(b))),
 _Dr, BYROW(MAP(_tbl, LAMBDA(a, N(a <> ""))), LAMBDA(b, SUM(b))),
 HSTACK(_ustud, _tbl, ROUND(_Nr / _Dr, 2))
)
Excel solution 12 for Calculate Percentage of Correct Answers, proposed by LEONARD OCHEA 🇷🇴:
=LET(c,LAMBDA(a,CHOOSECOLS(A2:D17,a)),r,UNIQUE(c(1)),d,UNIQUE(c(2)),e,TOROW(d),i,XLOOKUP(r&e,c(1)&c(2),IF(c(3)=c(4),"Y","N"),""),VSTACK(HSTACK(A1,"Q"&e,"%age Score"),HSTACK(r,i,MMULT((i="Y")^1,d^0)/MMULT((i<>"")^1,d^0))))Excel solution 13 for Calculate Percentage of Correct Answers, proposed by Tolga Demirci, PMP, PMI-ACP, MOS-Expert:
=LET(s;IF(C2:C17=D2:D17;"Y";"N");IFERROR(VSTACK(HSTACK("Student";"Q"&TOROW(SEQUENCE(MAX(B2:B17))));HSTACK(UNIQUE(A2:A17);TEXTSPLIT(CONCAT(MAP(UNIQUE(A2:A17);LAMBDA(y;TEXTJOIN(",";;TOROW(LET(x;IFERROR(MAP(A2:A17;s;LAMBDA(a;b;XLOOKUP(y;a;b)));"");FILTER(x;x<>""))))&":")));",";":";TRUE;0;"");ROUND(MAP(UNIQUE(A2:A17);LAMBDA(q;COUNTA(FILTER(A2:A17;(A2:A17=q)*(s="Y")))/COUNTIFS(A2:A17;q)));2)));"%ageScore"))&&