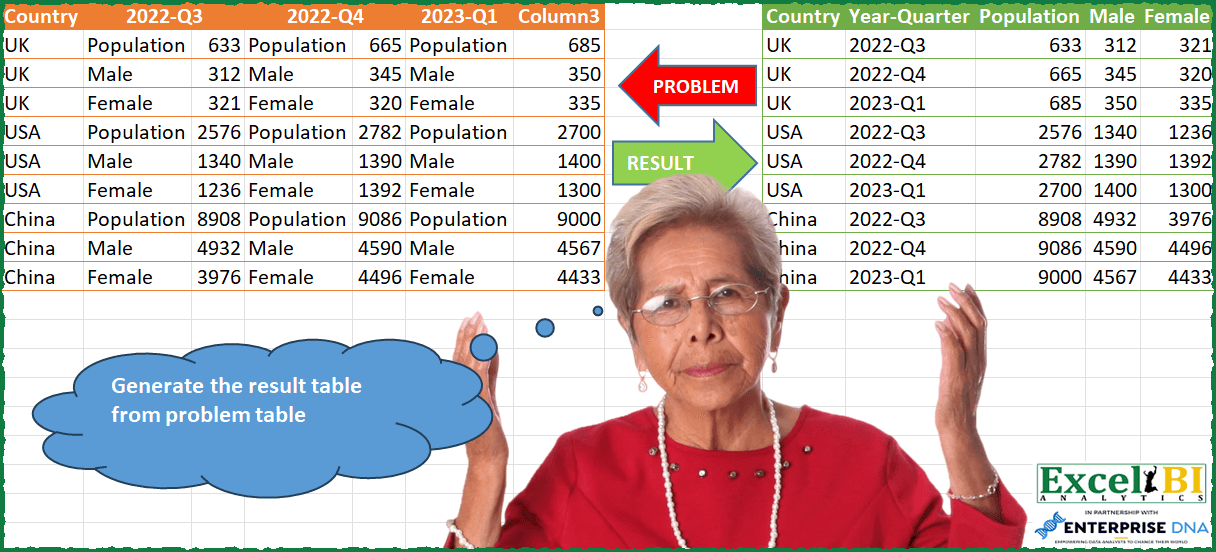
Generate the result table from problem table
📌 Challenge Details and Links
ExcelBI Power Query Challenge Number: 76
Challenge Difficulty: ⭐️⭐️⭐️⭐️
📥Download Sample File
📥Link to the solutions on LinkedIn
Solving the challenge of Create Simple Result Table with Power Query
Power Query solution 1 for Create Simple Result Table, proposed by Omid Motamedisedeh:
let
  Source = Excel.CurrentWorkbook(){[Name = "Table2"]}[Content],
  Solution = [
    A = Table.RenameColumns(
      Table.RemoveColumns(Source, {"2022-Q4", "2023-Q1"}),
      {{"2022-Q3", "X"}, {"Column1", "2022-Q3"}, {"Column2", "2022-Q4"}, {"Column3", "2023-Q1"}}
    ),
    B = Table.UnpivotOtherColumns(A, {"Country", "X"}, "Attribute", "Value"),
    C = Table.Pivot(B, List.Distinct(B[X]), "X", "Value", List.Sum)
  ][C]
in
  Solution
Power Query solution 2 for Create Simple Result Table, proposed by Bo Rydobon 🇹🇭:
let
  Source = Excel.CurrentWorkbook(){[Name = "Table1"]}[Content],
  Pop = Table.Combine(
    Table.Group(
      Source,
      "Country",
      {
        "T",
        (t) =>
          Table.FromRecords(
            List.Transform(
              List.Split(List.Skip(Table.ToColumns(t)), 2),
              each Record.FromList(_{1}, _{0})
            )
          )
      }
    )[T]
  ),
  CY = Table.ExpandListColumn(
    Table.AddColumn(
      Table.Distinct(Source[[Country]]),
      "Y",
      each List.Alternate(Table.ColumnNames(Source), 1, 1)
    ),
    "Y"
  ),
  Combine = Table.FromColumns(
    Table.ToColumns(CY) & Table.ToColumns(Pop),
    {"Country", "Year-Quarter"} & Table.ColumnNames(Pop)
  )
in
  Combine
Power Query solution 3 for Create Simple Result Table, proposed by Zoran Milokanović:
let
  Source = Excel.CurrentWorkbook(){[Name = "Input"]}[Content],
  UnpivotedOtherColumns = Table.UnpivotOtherColumns(Source, {"Country"}, "Attribute", "Value"),
  KeepValues = Table.AlternateRows(UnpivotedOtherColumns, 0, 1, 1)[Value],
  KeepOtherValues = Table.ToColumns(Table.AlternateRows(UnpivotedOtherColumns, 1, 1, 1)),
  CombineData = Table.FromColumns(
    KeepOtherValues & {KeepValues},
    {"Country", "Year-Quarter", "Attribute", "Value"}
  ),
  PivotedColumn = Table.Pivot(
    CombineData,
    List.Distinct(CombineData[Attribute]),
    "Attribute",
    "Value",
    List.Sum
  ),
  SortedRows = Table.Sort(
    PivotedColumn,
    {
      {each List.PositionOf(List.Distinct(Source[Country]), _[Country]), Order.Ascending},
      {"Year-Quarter", Order.Ascending}
    }
  )
in
  SortedRows
Power Query solution 4 for Create Simple Result Table, proposed by Aditya Kumar Darak 🇮🇳:
let
  Source     = Excel.CurrentWorkbook(){[Name = "data"]}[Content],
  Countries  = List.Distinct(Source[Country]),
  Unpivot    = Table.UnpivotOtherColumns(Source, {"Country"}, "Attribute", "Value"),
  Alternate1 = Table.AlternateRows(Unpivot, 1, 1, 1),
  Alternate2 = Table.AlternateRows(Unpivot, 0, 1, 1),
  Table      = Table.FromColumns(Table.ToColumns(Alternate1) & {Alternate2[Value]}),
  Pivot      = Table.Pivot(Table, List.Distinct(Table[Column3]), "Column3", "Column4"),
  Rename     = Table.RenameColumns(Pivot, {{"Column1", "Country"}, {"Column2", "Year-Quarter"}}),
  Return     = Table.Sort(Rename, {each List.PositionOf(Countries, [Country]), "Year-Quarter"})
in
  Return
Power Query solution 5 for Create Simple Result Table, proposed by Alejandro Simón 🇵🇦 🇪🇸:
let
  Source = Excel.CurrentWorkbook(){[Name = "Table2"]}[Content],
  Unpivot = Table.UnpivotOtherColumns(Source, {"Country"}, "Attribute", "Value"),
  NewCol = List.Skip(Unpivot[Value]) & {null},
  Select = Table.SelectRows(
    Table.FromColumns(
      Table.ToColumns(Unpivot) & {NewCol},
      {"Country", "Year-Quarter", "Col1", "Col2"}
    ),
    each not Text.StartsWith([#"Year-Quarter"], "Column")
  ),
  Sol = Table.Sort(
    Table.Pivot(Select, List.Distinct(Select[Col1]), "Col1", "Col2"),
    {each List.PositionOf(Source[Country], [Country]), "Year-Quarter"}
  )
in
  Sol
Power Query solution 6 for Create Simple Result Table, proposed by Luan Rodrigues:
let
  Fonte = Tabela1,
  gp = Table.Group(
    Fonte,
    {"Country"},
    {
      {
        "Contagem",
        each [
          a = Table.UnpivotOtherColumns(_, {"Country"}, "Year-Quarter", "Valor"),
          b = Table.AddColumn(
            Table.AddIndexColumn(a, "Ind", 0, 1),
            "Personalizar",
            each a{[Ind] + 1}[Valor]
          ),
          c = Table.RemoveColumns(
            Table.SelectRows(b, each Text.Contains([#"Year-Quarter"], "Q")),
            {"Ind"}
          ),
          d = Table.Pivot(c, List.Distinct(c[Valor]), "Valor", "Personalizar")
        ][d]
      }
    }
  ),
  res = Table.ExpandTableColumn(
    gp,
    "Contagem",
    List.RemoveFirstN(Table.ColumnNames(gp[Contagem]{0}), 1)
  )
in
  res
Power Query solution 7 for Create Simple Result Table, proposed by Alexis Olson:
let
  Source = Excel.CurrentWorkbook(){[Name = "Table1"]}[Content],
  Unpivot = Table.UnpivotOtherColumns(Source, {"Country"}, "Year-Quarter", "Column"),
  ExtractValue = Table.AddColumn(
    Unpivot,
    "Value",
    each if Value.Type([Column]) = type text then null else [Column]
  ),
  FillUp = Table.FillUp(ExtractValue, {"Value"}),
  FilterRows = Table.SelectRows(FillUp, each ([Value] <> [Column])),
  Pivot = Table.Pivot(FilterRows, List.Distinct(FilterRows[Column]), "Column", "Value", List.Sum)
in
  Pivot
Power Query solution 8 for Create Simple Result Table, proposed by Eric Laforce:
let
  Source = Excel.CurrentWorkbook(){[Name = "tData76"]}[Content],
  YQ_Names = List.Alternate(Table.ColumnNames(Source), 1, 1),
  Group = Table.Group(
    Source,
    {"Country"},
    {
      "All",
      each
        let
          _Cols = List.Skip(Table.ToColumns(_)),
          _Zip = List.Zip({List.Alternate(_Cols, 1, 1, 1), List.Alternate(_Cols, 1, 1), YQ_Names}),
          _ToRecord = List.Transform(
            _Zip,
            each Record.AddField(Record.FromList(_{1}, _{0}), "Year-Quarter", _{2})
          )
        in
          Table.FromRecords(_ToRecord)
    }
  ),
  Expand = Table.ExpandTableColumn(Group, "All", {"Year-Quarter", "Population", "Male", "Female"})
in
  Expand
Power Query solution 9 for Create Simple Result Table, proposed by Victor Wang:
let
  Source = Excel.CurrentWorkbook(){[Name = "Table1"]}[Content],
  getTables = List.Transform(
    List.Split(List.Skip(Table.ColumnNames(Source)), 2),
    each Table.Group(
      Table.AddColumn(Table.SelectColumns(Source, {"Country"} & _), "Year-Quarter", (a) => _{0}),
      {"Country", "Year-Quarter"},
      {
        {
          "all",
          each Table.PromoteHeaders(
            Table.Transpose(Table.RemoveColumns(_, {"Country", "Year-Quarter"}))
          )
        }
      }
    )
  ),
  Expand = Table.ExpandTableColumn(
    Table.Combine(getTables),
    "all",
    {"Population", "Male", "Female"}
  ),
  Sort = Table.Sort(Expand, {each List.PositionOf(Expand[Country], [Country]), "Year-Quarter"})
in
  Sort
Power Query solution 10 for Create Simple Result Table, proposed by Sandeep Marwal:
let
  Source = Excel.CurrentWorkbook(){[Name = "Table1"]}[Content],
  s1 = Table.Transpose(Source),
  s2 = Table.ReplaceValue(s1, "Column3", null, Replacer.ReplaceValue, {"Column1"}),
  s3 = Table.FillDown(s2, {"Column1"}),
  s4 = Table.Transpose(s3),
  s5 = Table.PromoteHeaders(s4, [PromoteAllScalars = true]),
  s6 = Table.CombineColumns(
    Table.TransformColumnTypes(s5, {{"2022-Q3_1", type text}}, "en-IN"),
    {"2022-Q3", "2022-Q3_1"},
    Combiner.CombineTextByDelimiter("=", QuoteStyle.None),
    "2022-Q3"
  ),
  s7 = Table.CombineColumns(
    Table.TransformColumnTypes(s6, {{"2022-Q4_2", type text}}, "en-IN"),
    {"2022-Q4", "2022-Q4_2"},
    Combiner.CombineTextByDelimiter("=", QuoteStyle.None),
    "2022-Q4"
  ),
  s8 = Table.CombineColumns(
    Table.TransformColumnTypes(s7, {{"2023-Q1_3", type text}}, "en-IN"),
    {"2023-Q1", "2023-Q1_3"},
    Combiner.CombineTextByDelimiter("=", QuoteStyle.None),
    "2023-Q1"
  ),
  s9 = Table.UnpivotOtherColumns(s8, {"Country"}, "Attribute", "Value"),
  s10 = Table.SplitColumn(
    s9,
    "Value",
    Splitter.SplitTextByDelimiter("=", QuoteStyle.Csv),
    {"Value.1", "Value.2"}
  ),
  s11 = Table.Pivot(s10, List.Distinct(s10[Value.1]), "Value.1", "Value.2")
in
  s11
Solving the challenge of Create Simple Result Table with Excel
Excel solution 1 for Create Simple Result Table, proposed by Bo Rydobon 🇹🇭:
=LET(z,A2:G10,h,A1:G1,b,INDEX(z,,2),c,UNIQUE(TAKE(z,,1)),y,FILTER(h,LEFT(h)="2"),d,TOCOL(IFNA(c,y)),
VSTACK(HSTACK(INDEX(h,1),"Year-Quarter",TOROW(UNIQUE(b))),
HSTACK(d,TOCOL(IFNA(y,c)),WRAPCOLS(TOCOL(--SORTBY(z,XMATCH(b,b)),3),ROWS(d)))))
Excel solution 2 for Create Simple Result Table, proposed by Bo Rydobon 🇹🇭:
=LET(z,A2:G10,h,A1:G1,b,INDEX(z,,2),c,INT(COLUMNS(z)/2),w,WRAPCOLS(TOCOL(SORTBY(--z,XMATCH(b,b)),3),c*ROWS(UNIQUE(TAKE(z,,1)))),
u,UNIQUE(b),r,SEQUENCE(ROWS(w))-1,VSTACK(HSTACK(A1,"Year-Quarter",TOROW(u)),HSTACK(INDEX(z,(INT(r/c)+1)*ROWS(u),1),INDEX(h,(MOD(r,c)+1)*2),w)))
Excel solution 3 for Create Simple Result Table, proposed by محمد حلمي:
=LET(b,B2:B10,r,ROWS(b),v,TOCOL(IFNA(B1:F1,b)),HSTACK(A2:A10,TAKE(FILTER(v,v>0),r),WRAPCOLS(TOCOL(SORTBY(FILTER(A2:G10,ISNUMBER(A2:G2)),MOD(SEQUENCE(r)-1,3)+1)),r)))Excel solution 4 for Create Simple Result Table, proposed by محمد حلمي:
=LET(
v,TOCOL(IFNA(B1:F1,B2:B10)),
HSTACK(A2:A10,TAKE(FILTER(v,v>0),
ROWS(B2:B10)),WRAPCOLS( TOCOL(SORTBY(HSTACK(C2:C10,E2:E10,G2:G10),
TOCOL(SEQUENCE(3)^0+SEQUENCE(,3)-1))),9)))
Excel solution 5 for Create Simple Result Table, proposed by 🇰🇷 Taeyong Shin:
=LET( Data, A2:G10,h, A1:G1,c, INDEX(Data, , 2), v, WRAPCOLS(TOCOL(SORTBY(FILTER(Data, ISNUMBER(TAKE(Data, 1))), XMATCH(c, c))), ROWS(c)),u, UNIQUE(c),VSTACK(HSTACK(T(h), "Year-Quarter", TOROW(u)), HSTACK(TAKE(Data, , 1), TOCOL(IFNA(FILTER(h, LEFT(h, 3) = "202"), u)), v)))Excel solution 6 for Create Simple Result Table, proposed by Oscar Mendez Roca Farell:
=HSTACK(A1:A10, REDUCE(HSTACK("Year-Quarter", TOROW(UNIQUE(B2:B10))), UNIQUE(A2:A10), LAMBDA(i, x, VSTACK(i, HSTACK(TOCOL(IF(LEFT(B1:G1)="2",B1:G1,NA()), 3), CHOOSEROWS( TRANSPOSE( FILTER(B2:G10, A2:A10=x)), {2,4,6}))))))Excel solution 7 for Create Simple Result Table, proposed by Sunny Baggu:
=LET(
 _input, A2:G10,
 _country, TAKE(_input, , 1),
 _ucountry, UNIQUE(_country),
 _tbl, WRAPROWS(TOCOL(DROP(_input, , 1)), 2),
 _val, WRAPROWS(DROP(_tbl, , 1), 3),
 _res, DROP(
 REDUCE(
 "",
 _ucountry,
 LAMBDA(a, v, VSTACK(a, TRANSPOSE(FILTER(_val, _country = v))))
 ),
 1
 ),
 HSTACK(
 _country,
 REDUCE(TOCOL(B1:F1, 1), SEQUENCE(2), LAMBDA(a, v, VSTACK(a, TOCOL(B1:F1, 1)))),
 _res
 )
)
Excel solution 8 for Create Simple Result Table, proposed by Sunny Baggu:
=LET(
 _input, A2:G10,
 _country, TAKE(_input, , 1),
 _yrqtr, TOCOL(IFNA(TOROW(B1:F1, 1), UNIQUE(_country))),
 _tbl, WRAPROWS(TOCOL(DROP(_input, , 1)), 2),
 _header, TOROW(UNIQUE(DROP(_tbl, , -1))),
 _col1, DROP(_tbl, , -1),
 _col2, DROP(_tbl, , 1),
 _val, DROP(
 REDUCE("", _header, LAMBDA(a, v, HSTACK(a, FILTER(_col2, _col1 = v)))),
 ,
 1
 ),
 VSTACK(
 HSTACK({"Country", "Year-Quarter"}, _header),
 HSTACK(_country, _yrqtr, _val)
 )
)
Excel solution 9 for Create Simple Result Table, proposed by Caroline Blake:
=LET(a,A2:G10,
_v1,TRANSPOSE(WRAPCOLS(CHOOSECOLS(a,3),3)),
_v2,TRANSPOSE(WRAPCOLS(CHOOSECOLS(a,5),3)),
_v3,TRANSPOSE(WRAPCOLS(CHOOSECOLS(a,7),3)),
t,VSTACK(HSTACK(SEQUENCE(3),UNIQUE(CHOOSECOLS(a,1)),BYROW(_v1,LAMBDA(x,1)),BYROW(_v1,LAMBDA(x,$B$1)),_v1),HSTACK(SEQUENCE(3),UNIQUE(CHOOSECOLS(a,1)),BYROW(_v1,LAMBDA(x,2)),BYROW(_v2,LAMBDA(x,$D$1)),_v2),HSTACK(SEQUENCE(3),UNIQUE(CHOOSECOLS(a,1)),BYROW(_v1,LAMBDA(x,3)),BYROW(_v3,LAMBDA(x,$F$1)),_v3)),
s,SORTBY(t,CHOOSECOLS(t,1),1,CHOOSECOLS(t,3),1),VSTACK(HSTACK("Country","Year-Quarter","Population","Male","Female"),CHOOSECOLS(s,2,4,5,6,7)))
&&&