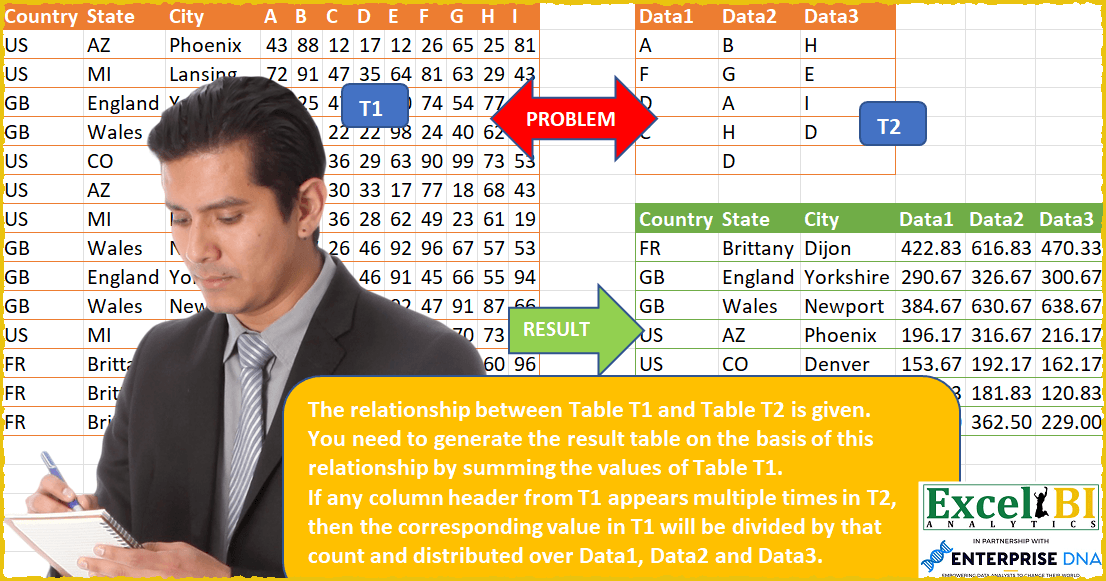
The relationship between Table T1 and Table T2 is given. You need to generate the result table on the basis of this relationship by summing the values of Table T1. If any column header from T1 appears multiple times in T2, then the corresponding value in T1 will be divided by that count and distributed over Data1, Data2 and Data3. For example, D appears 3 times once in each Data1, Data2 and Data3. Hence, the value of column D gets evenly spread over Data1, Data2 and Data3 by dividing column D value by 3. Similarly, A appears in Data1 and Data2. Hence, value of column A is divided by 2 and evenly spread to Data1 and Data2. Note here column A doesn’t means Excel’s column A but the header A given in row 1.
📌 Challenge Details and Links
ExcelBI Power Query Challenge Number: 53
Challenge Difficulty: ⭐️⭐️⭐️⭐️
📥Download Sample File
📥Link to the solutions on LinkedIn
Solving the challenge of Distribute Values by Mapping with Power Query
Power Query solution 1 for Distribute Values by Mapping, proposed by Bo Rydobon 🇹🇭:
let
  T1 = Excel.CurrentWorkbook(){[Name = "Table1"]}[Content],
  T2 = Excel.CurrentWorkbook(){[Name = "Table2"]}[Content],
  Div = Table.Group(
    Table.Group(Table.UnpivotOtherColumns(T2, {}, "A", "V"), "V", {"C", each Table.RowCount(_)}),
    "C",
    {"L", each [V]}
  ),
  Fd = Table.ColumnNames(T2),
  Replace = List.Accumulate(
    {0 .. Table.RowCount(Div) - 1},
    T1,
    (s, l) => Table.ReplaceValue(s, each _, 0, (x, y, z) => x / Div[C]{l}, Div[L]{l})
  ),
  Group = Table.Group(
    Replace,
    List.FirstN(Table.ColumnNames(T1), 3),
    {
      "R",
      each Record.FromList(
        List.Accumulate(
          Fd,
          {},
          (s, l) =>
            s
              & {
                List.Sum(
                  Table.UnpivotOtherColumns(
                    Table.SelectColumns(_, List.RemoveNulls(Table.Column(T2, l))),
                    {},
                    "1",
                    "V"
                  )[V]
                )
              }
        ),
        Fd
      )
    }
  ),
  Expanded = Table.Sort(
    Table.ExpandRecordColumn(Group, "R", Fd),
    List.FirstN(Table.ColumnNames(T1), 3)
  )
in
  Expanded
Power Query solution 2 for Distribute Values by Mapping, proposed by Rick de Groot:
let
  UT2 = Table.UnpivotOtherColumns(
    Table.Transpose(Table.DemoteHeaders(Table2)),
    {"Column1"},
    "Attribute",
    "Value"
  ),
  S = Table1,
  UnP = Table.UnpivotOtherColumns(S, {"Country", "State", "City"}, "Attribute", "Value"),
  Type = Table.TransformColumnTypes(UnP, {{"Value", Int64.Type}}),
  Grp = Table.Group(
    Type,
    {"Country", "State", "City", "Attribute"},
    {{"Value", each List.Sum([Value]), Int64.Type}}
  ),
  #"#" = Table.AddColumn(
    Grp,
    "Occurrences",
    (x) => List.Count(List.Select(List.Combine(Table.ToColumns(Table2)), each _ = x[Attribute])),
    Int64.Type
  ),
  Div = Table.ReplaceValue(
    #"#",
    each [Value],
    each [Value] / [Occurrences],
    Replacer.ReplaceValue,
    {"Value"}
  ),
  List = Table.AddColumn(
    Div,
    "Custom",
    (x) => Table.SelectRows(UT2, each [Value] = x[Attribute])[Column1],
    type {text}
  ),
  Exp = Table.ExpandListColumn(List, "Custom"),
  Remo = Table.RemoveColumns(Exp, {"Attribute", "Occurrences"}),
  Pvt = Table.Pivot(Remo, List.Distinct(Remo[Custom]), "Custom", "Value", List.Sum)
in
  Pvt
Power Query solution 3 for Distribute Values by Mapping, proposed by Luan Rodrigues:
let
  Fonte = Excel.CurrentWorkbook(){[Name = "Tabela1"]}[Content],
  Fonte1 = Excel.CurrentWorkbook(){[Name = "Tabela2"]}[Content],
  tab1 = Table.UnpivotOtherColumns(Fonte1, {}, "Atributo", "Valor"),
  tab0 = Table.UnpivotOtherColumns(Fonte, {"Country", "State", "City"}, "Atributo", "Valor"),
  mesc = Table.NestedJoin(tab0, {"Atributo"}, tab1, {"Valor"}, "tab0", JoinKind.LeftOuter),
  col = Table.AddColumn(mesc, "Personalizar", each Table.RowCount([tab0])),
  exp = Table.ExpandTableColumn(col, "tab0", {"Atributo"}, {"Atributo.1"}),
  vlr = Table.AddColumn(exp, "Personalizar.1", each [Valor] / [Personalizar]),
  rem = Table.SelectColumns(vlr, {"Country", "State", "City", "Atributo.1", "Personalizar.1"}),
  res = Table.Pivot(rem, List.Distinct(rem[Atributo.1]), "Atributo.1", "Personalizar.1", List.Sum)
in
  res
Power Query solution 4 for Distribute Values by Mapping, proposed by Brian Julius:
let
  Source = Excel.CurrentWorkbook(){[Name = "Table1"]}[Content],
  UnpivotSource = Table.UnpivotOtherColumns(
    Source,
    {"Country", "State", "City"},
    "Letter",
    "Amount"
  ),
  Aux = Table.AddIndexColumn(Excel.CurrentWorkbook(){[Name = "Table3"]}[Content], "Index", 1, 1),
  UnpivotAux = Table.UnpivotOtherColumns(Aux, {"Index"}, "DataCol", "Letter1"),
  Group = Table.Group(
    UnpivotAux,
    {"Letter1"},
    {
      {"All", each _, type table [Index = number, DataCol = text, Letter1 = text]},
      {"DivideBy", each Table.RowCount(_), Int64.Type}
    }
  ),
  Join = Table.RemoveColumns(Table.Join(UnpivotSource, "Letter", Group, "Letter1"), {"Letter1"}),
  Expand = Table.ExpandTableColumn(Join, "All", {"DataCol"}, {"DataCol"}),
  AddDiv = Table.RemoveColumns(
    Table.AddColumn(Expand, "Division", each [Amount] / [DivideBy], type number),
    {"Amount", "DivideBy", "Letter"}
  ),
  Pivot = Table.Pivot(AddDiv, List.Distinct(AddDiv[DataCol]), "DataCol", "Division", List.Sum)
in
  Pivot
Power Query solution 5 for Distribute Values by Mapping, proposed by Bhavya Gupta:
let
  Source = Excel.CurrentWorkbook(){[Name = "Table1"]}[Content],
  LookupTbl = Excel.CurrentWorkbook(){[Name = "Table2"]}[Content],
  U_2 = Table.UnpivotOtherColumns(LookupTbl, {}, "Attribute", "Value"),
  U_1 = Table.UnpivotOtherColumns(Source, {"Country", "State", "City"}, "Attribute", "Value"),
  Custom = Table.TransformColumns(
    U_1,
    {
      {
        "Attribute",
        each List.Transform(
          List.PositionOf(U_2[Value], _, Occurrence.All),
          (f) => U_2[Attribute]{f}
        )
      }
    }
  ),
  Replaced = Table.ReplaceValue(
    Custom,
    each [Attribute],
    null,
    (x, y, z) => Number.Round(x / List.Count(y), 2),
    {"Value"}
  ),
  Expanded = Table.ExpandListColumn(Replaced, "Attribute"),
  G_1 = Table.Group(
    Expanded,
    {"Country", "State", "City", "Attribute"},
    {{"Sum", each List.Sum([Value])}}
  ),
  G_2 = Table.Group(
    G_1,
    {"Country", "State", "City"},
    {{"All", each Record.FromList([Sum], [Attribute])}}
  ),
  ExpectedOutput = Table.Sort(
    Table.ExpandRecordColumn(G_2, "All", List.Distinct(U_2[Attribute])),
    {{"Country", Order.Ascending}, {"State", Order.Ascending}, {"City", Order.Ascending}}
  )
in
  ExpectedOutput
Power Query solution 6 for Distribute Values by Mapping, proposed by Krzysztof Kominiak:
let
  Source = Excel.CurrentWorkbook(){[Name = "Table1"]}[Content],
  UnpivotOthCols = Table.UnpivotOtherColumns(Source, {"Country", "State", "City"}, "Atr", "Value"),
  AddT2 = Table.AddColumn(
    UnpivotOthCols,
    "T2",
    each Table.SelectRows(
      Table.UnpivotOtherColumns(
        Excel.CurrentWorkbook(){[Name = "Table2"]}[Content],
        {},
        "Atr",
        "Value"
      ),
      (x) => [Atr] = x[Value]
    )[Atr]
  ),
  AddCosts = Table.AddColumn(AddT2, "Cost", each [Value] / List.Count([T2]), type number),
  ExpandToRows = Table.ExpandListColumn(AddCosts, "T2"),
  RemCols = Table.RemoveColumns(ExpandToRows, {"Atr", "Value"}),
  PivotCol = Table.Pivot(RemCols, List.Distinct(RemCols[T2]), "T2", "Cost", List.Sum)
in
  PivotCol
Power Query solution 7 for Distribute Values by Mapping, proposed by Thomas DUCROQUETZ:
let
  TableT1 = Excel.CurrentWorkbook(){[Name = "Table1"]}[Content],
  TableT2 = Excel.CurrentWorkbook(){[Name = "Table2"]}[Content],
  DataFields = Table.ColumnNames(TableT2),
  DataValues = List.Combine(Table.ToColumns(TableT2)),
  groupedRows = Table.Group(
    TableT1,
    {"Country", "State", "City"},
    List.Transform(
      DataFields,
      each {
        _,
        (x) =>
          List.Accumulate(
            List.Select(Table.Column(TableT2, _), (item) => item <> ""),
            0,
            (s, c) =>
              s + List.Sum(Table.Column(x, c)) / List.Count(List.Select(DataValues, each _ = c))
          ),
        type number
      }
    )
  )
in
  groupedRows
Solving the challenge of Distribute Values by Mapping with Excel
Excel solution 1 for Distribute Values by Mapping, proposed by Bo Rydobon 🇹🇭:
=LET(z,A2:L15,a,D1:L1,d,N2:P6,e,COUNTIF(d,a),u,SORT(UNIQUE(TAKE(z,,3)),{1,2,3}),
VSTACK(HSTACK(A1:C1,N1:P1),HSTACK(u,MAKEARRAY(ROWS(u),COLUMNS(d),LAMBDA(r,c,SUM(DROP(z,,3)/e*
(MMULT(N(INDEX(u,r,)=TAKE(z,,3)),{1;1;1})=3)*ISNUMBER(XMATCH(a,INDEX(d,,c)))))))))
Excel solution 2 for Distribute Values by Mapping, proposed by محمد حلمي:
=LET(r,C2:C15,u,UNIQUE(r),SORT(VSTACK(HSTACK(A1:C1,N1:P1),HSTACK(XLOOKUP(u,r,A2:A15),XLOOKUP(u,r,B2:B15),u,ROUND(MAKEARRAY(ROWS(u),3,LAMBDA(X,C,SUM(IF(INDEX(N2:P6,,C)=D1:L1,BYCOL(FILTER(D2:L15,INDEX(u,X)=r)/COUNTIF(N2:P6,D1:L1),LAMBDA(a,SUM(a))))))),2))),{1,2,3}))Excel solution 3 for Distribute Values by Mapping, proposed by محمد حلمي:
=LET(
r,C2:C15,
u,UNIQUE(r),
SORT(VSTACK(HSTACK(A1:C1,N1:P1),
HSTACK(
XLOOKUP(u,r,A2:A15),
XLOOKUP(u,r,B2:B15),
u,
ROUND(DROP(
REDUCE(0,SEQUENCE(3),LAMBDA(z,x,HSTACK(z,
REDUCE(0,u,LAMBDA(a,d,VSTACK(a,
SUM(IF(INDEX(N2:P6,,x)=D1:L1,
BYCOL(FILTER(D2:L15,d=r)/COUNTIF(N2:P6,D1:L1),
LAMBDA(a,SUM(a))))))))))),1,1),2))),{1,2,3}))
Excel solution 4 for Distribute Values by Mapping, proposed by 🇰🇷 Taeyong Shin:
=LET(d,D2:L15,t,N2:P6,GROUPBY(A1:C15,VSTACK(N1:P1,MAKEARRAY(ROWS(d),COLUMNS(t),LAMBDA(r,c,INDEX(BYROW(FILTER(d/COUNTIF(t,D1:L1),BYCOL(D1:L1=INDEX(t,,c),OR)),SUM),r)))),SUM,3,0))Excel solution 5 for Distribute Values by Mapping, proposed by Kris Jaganah:
=LET(a,A2:B15,b,C2:C15,c,D1:L1,d,DROP(TEXTSPLIT(CONCAT(REPT(b&",",COUNTA(c))),,","),-1),e,REPT(CONCAT(c),COUNTA(b)),f,MID(e,SEQUENCE(LEN(e)),1),g,TOCOL(D2:L15),i,UNIQUE(d&f),j,N1:P6,k,HSTACK(LEFT(i,LEN(i)-1),RIGHT(i),MAP(i,LAMBDA(x,SUM((x=d&f)*g)))),l,TOCOL(j,1,1),m,SCAN(,l,LAMBDA(x,y,IF(LEN(y)>1,y,x))),n,HSTACK(l,m),o,FILTER(n,l<>m),p,MAP(TAKE(o,,1),LAMBDA(x,SUM(--(x=TAKE(o,,1))))),q,MAP(CHOOSECOLS(k,2),LAMBDA(x,TEXTJOIN(",",1,FILTER(TAKE(n,,-1),TAKE(n,,1)=x)))),r,XLOOKUP(RIGHT(i),TAKE(o,,1),p),s,TAKE(k,,-1)/r,t,VSTACK(HSTACK(C1,N1:P1),HSTACK(LEFT(i,LEN(i)-1),IFERROR(IF(FIND($N$1:$P$1,q)>0,1,0),0)*s)),u,UNIQUE(b),v,TEXTSPLIT(TEXTJOIN(",",1,TOCOL(u&"-"&N1:P1)),"-",","),w,MAP(TAKE(v,,1),TAKE(v,,-1),LAMBDA(x,y,SUM(IFNA((DROP(TAKE(t,,1),1)=x)*(N1:P1=y)*DROP(TAKE(t,,-COUNTA(N1:P1)),1),0)))),x,HSTACK(v,w),y,HSTACK(XLOOKUP(u,b,a),XLOOKUP(u,b,TAKE(a,,-1)),u,XLOOKUP(u&N1:P1,TAKE(v,,1)&TAKE(v,,-1),w)),z,VSTACK(HSTACK(A1:C1,N1:P1),SORTBY(y,TAKE(y,,1),1,CHOOSECOLS(y,2),1,CHOOSECOLS(y,3),1)),z)Excel solution 6 for Distribute Values by Mapping, proposed by Hussein SATOUR:
=LET(
co, A2:A15, s, B2:B15, ci, C2:C15, d, N2:P6,l, D1:L1, v, D2:L15, a, SORT(UNIQUE(HSTACK(co, s, ci))),big, --WRAPROWS(TEXTSPLIT(
CONCAT(MAP(INDEX(a, , 1), INDEX(a, , 2), INDEX(a, , 3),
LAMBDA(a, b, c, CONCAT(BYCOL(d,LAMBDA(x,SUM(BYROW(x,LAMBDA(y,IF(y = "",0,
SUM(FILTER(FILTER(v,(co & s & ci =a & b & c)),l = y)) / COUNTIF(N2:P6, y))))))) & "/")))), "/", , 1), 3), HSTACK(a, big))
Excel solution 7 for Distribute Values by Mapping, proposed by Sunny Baggu:
=LET(_1st3col,SORT(UNIQUE(A2:C15),{1,2,3}),
HSTACK(_1st3col,
DROP(REDUCE("",SEQUENCE(COLUMNS(N1:P1)),LAMBDA(a,v,
HSTACK(a, MAP(CHOOSECOLS(_1st3col,1),CHOOSECOLS(_1st3col,2),CHOOSECOLS(_1st3col,3),LAMBDA(x,y,z,
LET(_country,$A$2:$A$15,_state,$B$2:$B$15,_city,$C$2:$C$15,

_dv1,INDEX(N$2:P$6,,v),
_dh1,SORT(TOROW(_dv1,1),,,TRUE),
_fil,FILTER(FILTER($D$2:$L$15,IFNA(XMATCH($D$1:$L$1,_dh1),0)),_country&_state&_city=x&y&z),
_n,COUNTIFS($N$2:$P$6,_dh1),_filsum,BYCOL(_fil,LAMBDA(a,SUM(a))),ROUND(SUM(MAP(_filsum,_n,LAMBDA(a,b,SUM(a/b)))),2))))))),,1)))
Excel solution 8 for Distribute Values by Mapping, proposed by Stevenson Yu:
=QUERY(A2:L15,"Select A, B, C, sum(D)/2 + sum(I) + sum(G)/3 + sum(F), sum(E) + sum(J) + sum(D)*1/2 + sum(K)/2 + sum(G)*1/3, sum(K)*1/2 + sum(H) + sum(L) + sum(G)*2/6 group by A,B,C")

Or if you need pretty column names:
=QUERY(A2:L15,"Select A, B, C, sum(D)/2 + sum(I) + sum(G)/3 + sum(F), sum(E) + sum(J) + sum(D)*1/2 + sum(K)/2 + sum(G)*1/3, sum(K)*1/2 + sum(H) + sum(L) + sum(G)*2/6 group by A,B,C label A 'Country', B 'State', C 'City', sum(D)/2 + sum(I) + sum(G)/3 + sum(F) 'Data1', sum(E) + sum(J) + sum(D)*1/2 + sum(K)/2 + sum(G)*1/3 'Data2', sum(K)*1/2 + sum(H) + sum(L) + sum(G)*2/6 'Data3'")
&&&