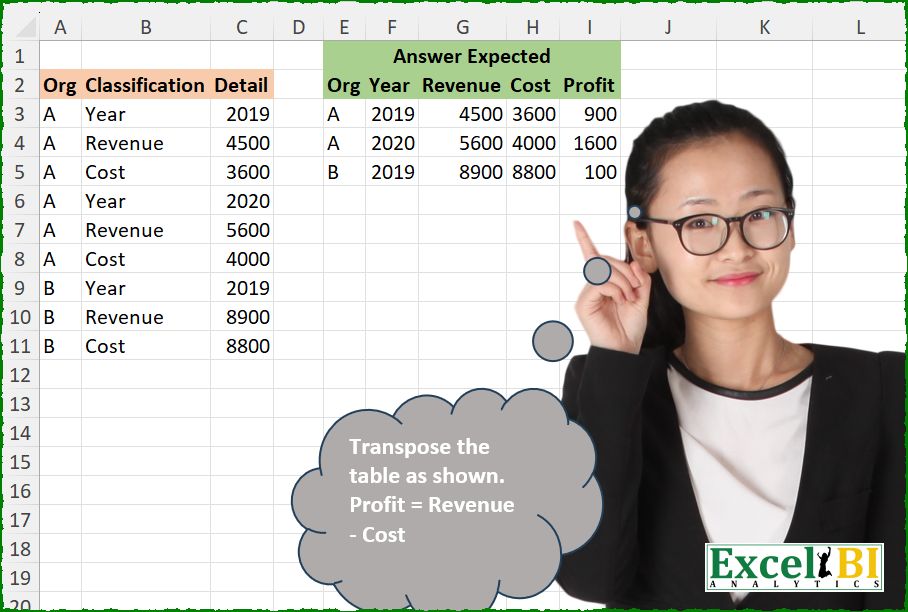
Transpose the table as shown. Profit = Revenue – Cost
📌 Challenge Details and Links
ExcelBI Excel Challenge Number: 670
Challenge Difficulty: ⭐️
📥Download Sample File
📥Link to the solutions on LinkedIn
Solving the challenge of Transpose Table With Profit with Power Query
Power Query solution 1 for Transpose Table With Profit, proposed by Kris Jaganah:
let
  A = Excel.CurrentWorkbook(){[Name = "Table1"]}[Content],
  B = Table.Combine(
    Table.Group(
      A,
      "Classification",
      {
        "All",
        each [
          a = Table.ToColumns(_),
          b = Table.FromList(
            {a},
            (v) => {v{0}{0}} & v{2} & {v{2}{1} - v{2}{2}},
            {"Org"} & a{1} & {"Profit"}
          )
        ][b]
      },
      0,
      (x, y) => Number.From(y = "Year")
    )[All]
  )
in
  B
Power Query solution 2 for Transpose Table With Profit, proposed by Alejandro Simón 🇵🇦 🇪🇸:
let
  Origen = Excel.CurrentWorkbook(){[Name = "Tabla1"]}[Content],
  A = Table.AddColumn(Origen, "Year", each if [Classification] = "Year" then [Detail] else null),
  FD = Table.FillDown(A, {"Year"}),
  TSR = Table.SelectRows(FD, each ([Classification] <> "Year")),
  Sol = Table.Combine(
    Table.Group(
      TSR,
      {"Org", "Year"},
      {
        {
          "A",
          each
            let
              a = _,
              b = Table.Pivot(a, List.Distinct(a[Classification]), "Classification", "Detail"),
              c = Table.AddColumn(b, "Profit", each [Revenue] - [Cost])
            in
              c
        }
      }
    )[A]
  )
in
  Sol
Power Query solution 3 for Transpose Table With Profit, proposed by Luan Rodrigues:
let
  Fonte = Table.AddIndexColumn(Tabela1, "Ind", 1),
  Add = Table.AddColumn(Fonte, "valor", each if Number.Mod([Ind], 3) = 0 then [Ind] else null),
  pc = Table.FillUp(Add, {"valor"}),
  grp = Table.Group(
    pc,
    {"Org", "valor"},
    {
      {
        "tab",
        each
          let
            a = _[[Classification], [Detail]],
            b = Table.Pivot(a, List.Distinct(a[Classification]), "Classification", "Detail"),
            c = Table.AddColumn(b, "Profit", each List.Sum({[Revenue], - [Cost]}))
          in
            c
      }
    }
  ),
  exp = Table.ExpandTableColumn(grp, "tab", Table.ColumnNames(grp[tab]{0})),
  rem = Table.RemoveColumns(exp, {"valor"})
in
  rem
Power Query solution 4 for Transpose Table With Profit, proposed by Abdallah Ally:
let
  Source = Excel.CurrentWorkbook(){[Name = "Table1"]}[Content],
  Result = Table.Combine(
    List.Transform(
      Table.Split(Source, 3),
      each Table.AddColumn(
        Table.Pivot(_, List.Distinct([Classification]), "Classification", "Detail"),
        "Profit",
        each [Revenue] - [Cost]
      )
    )
  )
in
  Result
Power Query solution 5 for Transpose Table With Profit, proposed by Seokho MOON:
let
  Source = Excel.CurrentWorkbook(){[Name = "Table1"]}[Content],
  ColNames = {"Org"} & List.Distinct(Source[Classification]) & {"Profit"},
  Res = Table.FromList(
    Table.Split(Source, 3),
    each {[Org]{0}} & [Detail] & {[Detail]{1} - [Detail]{2}},
    ColNames
  )
in
  Res
Power Query solution 6 for Transpose Table With Profit, proposed by Meganathan Elumalai:
let
  Source = Excel.CurrentWorkbook(){[Name = "Table1"]}[Content],
  Transform = Table.TransformColumns(
    Table.AddIndexColumn(Source, "Index", 0),
    {"Index", each 1 + Number.IntegerDivide(_, List.Count(List.Distinct(Source[Classification])))}
  ),
  Result = Table.RemoveColumns(
    Table.AddColumn(
      Table.Pivot(Transform, List.Distinct(Source[Classification]), "Classification", "Detail"),
      "Profit",
      each [Revenue] - [Cost]
    ),
    {"Index"}
  )
in
  Result
Power Query solution 7 for Transpose Table With Profit, proposed by Antriksh Sharma:
let
  Source = Table,
  Pivot = Table.Pivot(
    Source,
    List.Distinct(Source[Classification]),
    "Classification",
    "Detail",
    each _
  ),
  List = Table.TransformColumns(Pivot, {"Org", each {_}}),
  Transform = Table.CombineColumns(
    List,
    Table.ColumnNames(List),
    each Table.FillDown(
      Table.AddColumn(
        Table.FromColumns(
          _,
          type table [Org = text, Year = Int64.Type, Revenue = number, Cost = number]
        ),
        "Profit",
        each [Revenue] - [Cost],
        type number
      ),
      {"Org"}
    ),
    "T"
  )[T],
  Combine = Table.Combine(Transform)
in
  Combine
Power Query solution 8 for Transpose Table With Profit, proposed by Peter Krkos:
let a = Table.ToColumns(_)
 in Table.AddColumn(Table.FromRows({{a{0}{0}} & a{2}}, {"Org"} & a{1}), "Profit", (x)=> x[Revenue] - x[Cost], Int64.Type)))
Power Query solution 9 for Transpose Table With Profit, proposed by Peter Krkos:
let
  #"Added Index" = Table.AddIndexColumn(Source, "Index", 0, 1, Int64.Type),
  #"Integer-Divided Column" = Table.TransformColumns(
    #"Added Index",
    {{"Index", each Number.IntegerDivide(_, 3), Int64.Type}}
  ),
  #"Pivoted Column" = Table.Pivot(
    #"Integer-Divided Column",
    List.Distinct(#"Integer-Divided Column"[Classification]),
    "Classification",
    "Detail"
  ),
  #"Inserted Subtraction" = Table.AddColumn(
    #"Pivoted Column",
    "Profit",
    each [Revenue] - [Cost],
    Int64.Type
  ),
  #"Removed Columns" = Table.RemoveColumns(#"Inserted Subtraction", {"Index"})
in
  #"Removed Columns"
Power Query solution 10 for Transpose Table With Profit, proposed by CA Raghunath Gundi:
let
  Source = Excel.CurrentWorkbook(){[Name = "Table1"]}[Content],
  Index = Table.AddIndexColumn(Source, "Index", 0, 1, Int64.Type),
  Condition = Table.FillDown(
    Table.AddColumn(Index, "Num", each if [Classification] = "Year" then [Index] else null),
    {"Num"}
  ),
  RemoveIndex = Table.RemoveColumns(Condition, {"Index"}),
  Pivot = Table.Pivot(
    RemoveIndex,
    List.Distinct(RemoveIndex[Classification]),
    "Classification",
    "Detail"
  ),
  Table = Table.SelectColumns(Pivot, {"Org", "Year", "Revenue", "Cost"}),
  Profit = Table.AddColumn(Table, "Profit", each [Revenue] - [Cost], type number)
in
  Profit
Power Query solution 11 for Transpose Table With Profit, proposed by Yaroslav Drohomyretskyi:
let
  Source = Excel.CurrentWorkbook(){[Name = "Table1"]}[Content],
  Year = Table.AddColumn(Source, "Year", each if [Classification] = "Year" then [Detail] else null),
  Fill = Table.FillDown(Year, {"Year"}),
  Clean = Table.SelectRows(Fill, each ([Classification] <> "Year")),
  Pivot = Table.Pivot(
    Clean,
    List.Distinct(Clean[Classification]),
    "Classification",
    "Detail",
    List.Sum
  ),
  Profit = Table.AddColumn(Pivot, "Profit", each [Revenue] - [Cost])
in
  Profit
Power Query solution 12 for Transpose Table With Profit, proposed by Mihai Radu O:
let
  Source = Excel.CurrentWorkbook(){[Name = "Table1"]}[Content],
  grup = Table.Combine(
    Table.Group(
      Source,
      {"Org", "Classification"},
      {
        {
          "all",
          each [
            org = List.Distinct([Org]),
            a   = Table.PromoteHeaders(Table.RemoveFirstN(Table.Transpose(_), 1)),
            b   = Table.AddColumn(a, "Profit", each [Revenue] - [Cost]),
            c   = Table.FromColumns({org} & Table.ToColumns(b), {"Org"} & Table.ColumnNames(b))
          ][c]
        }
      },
      GroupKind.Local,
      (x, y) => Number.From(y[Classification] = "Year")
    )[all]
  )
in
  grup
Power Query solution 13 for Transpose Table With Profit, proposed by Melissa de Korte:
let
  Source = Excel.CurrentWorkbook(){[Name = "Table1"]}[Content],
  Rows = Table.ToRecords(Source),
  Accumulated = List.Accumulate(
    List.Split(Rows, 3),
    {},
    (s, a) =>
      s
        & {
          [
            Org     = a{0}[Org],
            Year    = a{0}[Detail],
            Revenue = a{1}[Detail],
            Cost    = a{2}[Detail],
            Profit  = Revenue - Cost
          ]
        }
  ),
  toTable = Table.FromRecords(Accumulated)
in
  toTable
Power Query solution 14 for Transpose Table With Profit, proposed by Khanh Lam chi:
let
 Source = Excel.CurrentWorkbook(){[Name="Table1"]}[Content],
 Result = Table.Combine(List.Transform(Table.Split(Source,3), (n)=> let tc = Table.ToColumns(n) in hashtag#table({"Org"}&tc{1}&{"Profit"},{{tc{0}{0}}&tc{2}&{tc{2}{1}-tc{2}{2}}})))
in
 Result
Solving the challenge of Transpose Table With Profit with Excel
Excel solution 1 for Transpose Table With Profit, proposed by Rick Rothstein:
=LET(
    d,
    WRAPROWS(
        C3:C11,
        3
    ),
    HSTACK(
        FILTER(
            A3:A11,
            B3:B11="Year"
        ),
        d,
        BYROW(
            TAKE(
                d,
                ,
                -2
            )*{1,
            -1},
            SUM
        )
    )
)

With headers...
=LET(
    d,
    WRAPROWS(
        C3:C11,
        3
    ),
    VSTACK(
        TOROW(
            VSTACK(
                A2,
                B3:B5,
                "Profit"
            )
        ),
        HSTACK(
            FILTER(
                A3:A11,
                B3:B11="Year"
            ),
            d,
            BYROW(
            TAKE(
                d,
                ,
                -2
            )*{1,
            -1},
            SUM
        )
        )
    )
)
Excel solution 2 for Transpose Table With Profit, proposed by John V.:
=LET(
    d,
    WRAPROWS(
        C3:C11,
        3
    ),
    HSTACK(
        FILTER(
            A3:A11,
            B3:B11=B3
        ),
        d,
        MMULT(
            d,
            {0;1;-1}
        )
    )
)
Excel solution 3 for Transpose Table With Profit, proposed by Kris Jaganah:
=LET(a,B3:B11,b,DROP(PIVOTBY(HSTACK(SCAN(0,a="Year",SUM),A3:A11),a,C3:C11,SUM,0,0,,0,-1),,1),c,HSTACK(b,VSTACK("Profit",MMULT(DROP(b,1,2),{1;-1}))),IF(c="",A2,c))Excel solution 4 for Transpose Table With Profit, proposed by Timothée BLIOT:
=LET(A,C3:C11,B,WRAPROWS(A,3),C,INDEX(B,,2),D,C-TAKE(B,,-1), HSTACK(XLOOKUP(C,A,A3:A11),B,D))Excel solution 5 for Transpose Table With Profit, proposed by Hussein SATOUR:
=LET(
    C,
    CHOOSECOLS,
    H,
    HSTACK,
    f,
    B3:B11,
    d,
    C3:C11,
    y,
    SCAN(
        ,
        IF(
            f="Year",
            d,
            0
        ),
        LAMBDA(
            x,
            y,
            IF(
                y=0,
                x,
                y
            )
        )
    ),
    a,
    FILTER(
        H(
            A3:A11,
            y,
            f,
            d
        ),
        f<>"Year"
    ),
    b,
    DROP(
        PIVOTBY(
            C(
                a,
                1,
                2
            ),
            C(
                a,
                3
            ),
            C(
                a,
                4
            ),
            SUM,
            ,
            0
        ),
        1,
        -1
    ),
    VSTACK(
        {"Org",
        "Year",
        "Revenue",
        "Cost",
        "Profit"},
        H(
            b,
            C(
                b,
                4
            )-C(
                b,
                3
            )
        )
    )
)
Excel solution 6 for Transpose Table With Profit, proposed by Oscar Mendez Roca Farell:
=LET(
    F,
    WRAPROWS,
    w,
    F(
        C3:C11,
        3
    ),
    VSTACK(
        HSTACK(
            A2,
            TOROW(
                B3:B5
            ),
            "Profit"
        ),
        HSTACK(
            TAKE(
                F(
                    A3:A11,
                    3
                ),
                ,
                1
            ),
            w,
            BYROW(
                DROP(
                    w,
                    ,
                    1
                )*{1,
                -1},
                SUM
            )
        )
    )
)
Excel solution 7 for Transpose Table With Profit, proposed by Duy Tùng:
=LET(a,A3:A11,b,REDUCE(TOROW(VSTACK(A2,B3:B5)),UNIQUE(a),LAMBDA(x,y,VSTACK(x,IFNA(HSTACK(y,WRAPROWS(FILTER(C3:C11,a=y),3)),y)))),HSTACK(b,IFERROR(INDEX(b,,3)-INDEX(b,,4),"Profit")))

hashtag#pivotby
=LET(a,B3:B11,b,DROP(PIVOTBY(HSTACK(SCAN(0,a="year",SUM),A3:A11),a,C3:C11,SINGLE,,0,,0,-1),,1),HSTACK(IF(b="",A2,b),IFERROR(INDEX(b,,3)-INDEX(b,,4),"Profit")))
Excel solution 8 for Transpose Table With Profit, proposed by Sunny Baggu:
=LET(
 _a, FILTER(HSTACK(A3:A11, C3:C11), B3:B11 = B3),
 _b, INDEX(
 C3:C11,
 XMATCH(TAKE(_a, , 1) & TAKE(_a, , -1), A3:A11 & C3:C11) +
 {1, 2}
 ),
 _c, BYROW(_b * {1, -1}, LAMBDA(a, SUM(a))),
 HSTACK(_a, _b, _c)
)
Excel solution 9 for Transpose Table With Profit, proposed by Anshu Bantra:
=LET(
 raw_, A3:C11,
 rows_, SORT(UNIQUE(CHOOSECOLS(FILTER(raw_, CHOOSECOLS(raw_, 2) = "Year"), 1, 3))),
 data_, DROP(WRAPROWS(CHOOSECOLS(raw_, 3), 3), , 1),
 VSTACK(
 TRANSPOSE(VSTACK("Org", UNIQUE(CHOOSECOLS(raw_, 2)), "Profit")),
 HSTACK(rows_, data_, CHOOSECOLS(data_, 1) - CHOOSECOLS(data_, 2))
 )
)
Excel solution 10 for Transpose Table With Profit, proposed by Md. Zohurul Islam:
=LET(u,A3:A11,v,C3:C11,hdr,HSTACK(A2,TOROW(UNIQUE(B3:B11)),"Profit"),w,REDUCE(hdr,UNIQUE(u),LAMBDA(x,y,LET(a,WRAPROWS(FILTER(v,u=y),3),b,BYROW(DROP(a,,1)*{1,-1},SUM),VSTACK(x,IFNA(HSTACK(y,a,b),y))))),w)Excel solution 11 for Transpose Table With Profit, proposed by Pieter de B.:
=LET(c,CHOOSECOLS,w,c(WRAPROWS(TOCOL(A3:C11),9),1,3,6,9),HSTACK(w,MMULT(c(w,3,4),{1;-1})))

Or with headers:
=LET(c,CHOOSECOLS,w,c(WRAPROWS(TOCOL(A3:C11),9),1,3,6,9),VSTACK(TOROW(VSTACK(A2,B3:B5,"Profit")),HSTACK(w,MMULT(c(w,3,4),{1;-1}))))
Excel solution 12 for Transpose Table With Profit, proposed by Hamidi Hamid:
=LET(a,A3:A11,b,TEXTAFTER(SCAN(,IF(B3:B11="year",B3:B11&"-"&C3:C11,""),CONCAT),"-",-1),y,B3:B11,c,C3:C11,z,DROP(PIVOTBY(HSTACK(a,b),y,c,SUM,,0,,0),,-1),HSTACK(z,IFERROR(TAKE(z,,-1)-CHOOSECOLS(z,3),"Profit")))Excel solution 13 for Transpose Table With Profit, proposed by Asheesh Pahwa:
=LET(
    r,
    DROP(
        REDUCE(
            "",
            {"A",
            "B"},
            LAMBDA(
                x,
                y,
                VSTACK(
                    x,

                    LET(
                        f,
                        FILTER(
                            B2:C10,
                            A2:A10=y
                        ),
                        t,
                        TAKE(
                            f,
                            ,
                            -1
                        ),
                        w,
                        WRAPROWS(
                            t,
                            3
                        ),
                        p,
                        INDEX(
                            w,
                            ,
                            2
                        )-INDEX(
                            w,
                            ,
                            3
                        ),
                        u,
                        UNIQUE(
                            TAKE(
                                f,
                                ,
                                1
                            )
                        ),
                        IFNA(
                            HSTACK(
                                y,
                                w,
                                p
                            ),
                            y
                        )
                    )
                )
            )
        ),
        1
    ),

    VSTACK(
        HSTACK(
            F1,
            TOROW(
                UNIQUE(
                    B2:B10
                )
            ),
            "Profit"
        ),
        r
    )
)
Excel solution 14 for Transpose Table With Profit, proposed by Eric Laforce:
=LET(n, 3, newCOrg, INDEX(tData[Org], SEQUENCE(n, , 1, n)), newCols, WRAPROWS(tData[Detail], n), newCProf, INDEX(newCols, , 2) - INDEX( newCols, , 3), newTab, HSTACK(newCOrg, newCols, newCProf), newH, HSTACK({"Org"},TRANSPOSE(INDEX(tData[Classification], SEQUENCE(n, , 1))),{"Profit"}), VSTACK(newH, newTab))Excel solution 15 for Transpose Table With Profit, proposed by ferhat CK:
=LET(
    a,
    WRAPROWS(
        C3:C11,
        3
    ),
    b,
    TAKE(
        TAKE(
            a,
            ,
            -2
        ),
        ,
        1
    )-TAKE(
        TAKE(
            a,
            ,
            -2
        ),
        ,
        -1
    ),
    HSTACK(
        FILTER(
            A3:A11,
            ISNUMBER(
                XMATCH(
                    B3:B11,
                    B3
                )
            )
        ),
        a,
        b
    )
)
Excel solution 16 for Transpose Table With Profit, proposed by Jaroslaw Kujawa:
=LET(y;DROP(REDUCE("";B3:B11;LAMBDA(a;x;IF(x="Year";VSTACK(a;HSTACK(OFFSET(x;;-1);TRANSPOSE(OFFSET(x;;1;3))));a)));1);VSTACK(TRANSPOSE({"Org";"Year";"Revenue";"Cost";"Profit"});HSTACK(y;CHOOSECOLS(y;3)-TAKE(y;;-1))))Excel solution 17 for Transpose Table With Profit, proposed by Andy Heybruch:
=LET(

    _detail,
    WRAPROWS(
        C3:C11,
        3
    ),

    HSTACK(

         INDEX(
             A3:A11,
             SEQUENCE(
                 3,
                 ,
                 ,
                 3
             )
         ),

         _detail,

         CHOOSECOLS(
             _detail,
             2
         )-CHOOSECOLS(
             _detail,
             3
         )
    )
)
Excel solution 18 for Transpose Table With Profit, proposed by Meganathan Elumalai:
=REDUCE({"Org","Year","Revenue","Cost","Profit"},UNIQUE(A3:A11),LAMBDA(a,v,IFNA(VSTACK(a,LET(c,DROP(REDUCE("",UNIQUE(B3:B11),LAMBDA(x,y,HSTACK(x,FILTER(C3:C11,(A3:A11=v)*(B3:B11=y))))),,1),HSTACK(v,c,INDEX(c,,2)-INDEX(c,,3)))),v)))Excel solution 19 for Transpose Table With Profit, proposed by Imam Hambali:
=LET(
w, WRAPROWS,
cc, CHOOSECOLS,
t, HSTACK(TAKE(w(A3:A11,3),,1),w(C3:C11,3)),
VSTACK({"Org","Year","Revenue","Cost","Profit"}, HSTACK(t, cc(t,3)-cc(t,4)))
)
Excel solution 20 for Transpose Table With Profit, proposed by Peter Bartholomew:
= LET(
 wrapped, WRAPROWS(TOCOL(DataTbl), 9),
 profit, CHOOSECOLS(wrapped, 6) - CHOOSECOLS(wrapped, 9),
 table,  HSTACK(CHOOSECOLS(wrapped,{1,3,6,9}), profit),
 hdr,   {"Org","Year","Revenue","Cost","Profit"},
 VSTACK(hdr, table)
 )
Excel solution 21 for Transpose Table With Profit, proposed by CA Mohit Saxena:
=LET(
    x,
    WRAPROWS(
        C3:C11,
        3
    ),
    y,
    B3:B11,
    VSTACK(
        HSTACK(
            A2,
            TOROW(
                UNIQUE(
                    y
                )
            ),
            "Profit"
        ),
        HSTACK(
            FILTER(
                A3:A11,
                y="Year"
            ),
            x,
            MAP(
                CHOOSECOLS(
                    x,
                    -2
                ),
                CHOOSECOLS(
                    x,
                    -1
                ),
                LAMBDA(
                    a,
                    b,
                    a-b
                )
            )
        )
    )
)
Excel solution 22 for Transpose Table With Profit, proposed by O. Zini:
=LAMBDA(my_range;
 LET(
 col_difference; LAMBDA(r; c; arr;
 INDEX(arr; r; c - 2) -
 INDEX(arr; r; c - 1)
 );
 a; TAKE(my_range; ; 1);
 b; TAKE(my_range; ; -1);
 c; BYROW(
 WRAPROWS(a; 3);
 LAMBDA(x; UNIQUE(x; TRUE))
 );
 d; WRAPROWS(b; 3);
 stacked_array; HSTACK(c; d);
 cols; COLUMNS(stacked_array);
 rows; ROWS(stacked_array);
 final_array; MAKEARRAY(
 rows;
 cols + 1;
 LAMBDA(r; c;
 IF(
 c > cols;
 col_difference(
 r;
 c;
 stacked_array
 );
 INDEX(stacked_array; r; c)
 )
 )
 );
 final_array
 )
)(A3:C11)
Excel solution 23 for Transpose Table With Profit, proposed by lee tran:
=LET(
_detail;WRAPROWS(C3:C11;3);
_profit; BYROW(_detail;LAMBDA(_x; CHOOSECOLS(_x;2) - CHOOSECOLS(_x;3)));
_org; TAKE(WRAPROWS(A3:A11;3);;1);
_class;TAKE(WRAPROWS(B3:B11;3);1);
_kq; HSTACK(_org;_detail;_profit);
_kq2; VSTACK(HSTACK("Org";_class;"Profit");_kq);
_kq2
)
Excel solution 24 for Transpose Table With Profit, proposed by Sumesh Paruthikad:
=LET(
    c,
    CHOOSECOLS,

     d,
    WRAPROWS(
        C3:C11,
        3
    ),

    Org,
    c(
        WRAPROWS(
            A3:A11,
            3
        ),
        1
    ),

    Profit,
    c(
        d,
        2
    )-c(
        d,
        3
    ),

    dtbl,
    HSTACK(
        d,
        Profit
    ),

    header,
    TOROW(
        VSTACK(
            {"Org"},
            UNIQUE(
                B3:B11
            ),
            {"Profit"}
        )
    ),

    body,
    HSTACK(
        Org,
        dtbl
    ),

    finaltbl,
    VSTACK(
        header,
        body
    ),

    finaltbl

)
Solving the challenge of Transpose Table With Profit with Python
Python solution 1 for Transpose Table With Profit, proposed by Konrad Gryczan, PhD:
import pandas as pd
path = "670 Transpose.xlsx"
input = pd.read_excel(path, sheet_name=0, usecols="A:C", skiprows=1, nrows=10)
test = pd.read_excel(path, sheet_name=0, usecols="E:I", skiprows=1, nrows=3).rename(columns=lambda x: x.split('.')[0])
input['Year'] = input.apply(lambda row: row['Detail'] if row['Classification'] == 'Year' else None, axis=1)
input['Year'] = input['Year'].ffill().astype('int64')
input = input[input['Classification'] != 'Year']
result = input.pivot(index=['Org','Year'], columns='Classification', values='Detail').reset_index()
result['Profit'] = result['Revenue'] - result['Cost']
result.columns.name = None
result = result[['Org', 'Year', 'Revenue', 'Cost', 'Profit']]
print(result.equals(test)) # True
Python solution 2 for Transpose Table With Profit, proposed by Luan Rodrigues:
import pandas as pd
import numpy as np
file = "Excel_Challenge_670 - Transpose.xlsx"
df = pd.read_excel(file, usecols='A:C', skiprows=1)
df['Ind'] = np.where(df['Classification'] == 'Year', df.index, np.nan)
df['Ind'] = df['Ind'].ffill()
grp = df.groupby(['Org', 'Ind']).apply(
 lambda x: x.pivot_table(
 index='Org',
 columns='Classification',
 values='Detail',
 sort=False
 ).reset_index(drop=True)
)
grp = grp.reset_index(level=0).reset_index(drop=True)
grp['Profit'] = grp['Revenue'] - grp['Cost']
print(grp)
Solving the challenge of Transpose Table With Profit with Python in Excel
Python in Excel solution 1 for Transpose Table With Profit, proposed by Alejandro Campos:
df = xl("A2:C11", headers=True)
[[g["Org"].iloc[0]] + g["Detail"].values.tolist() + [g["Detail"].iloc[1] - g["Detail"].iloc[2]] for _, g in df.groupby(df.index // 3)]
Solving the challenge of Transpose Table With Profit with R
R solution 1 for Transpose Table With Profit, proposed by Konrad Gryczan, PhD:
library(tidyverse)
library(readxl)
path = "Excel/670 Transpose.xlsx"
input = read_excel(path, range = "A2:C11")
test = read_excel(path, range = "E2:I5")
result = input %>%
 mutate(Year = ifelse(Classification == "Year", Detail, NA)) %>%
 fill(Year) %>%
 filter(Classification != "Year") %>%
 pivot_wider(names_from = Classification, values_from = Detail) %>%
 mutate(Profit = Revenue - Cost)
all.equal(result, test, check.attributes = FALSE)
#> [1] TRUE
&&