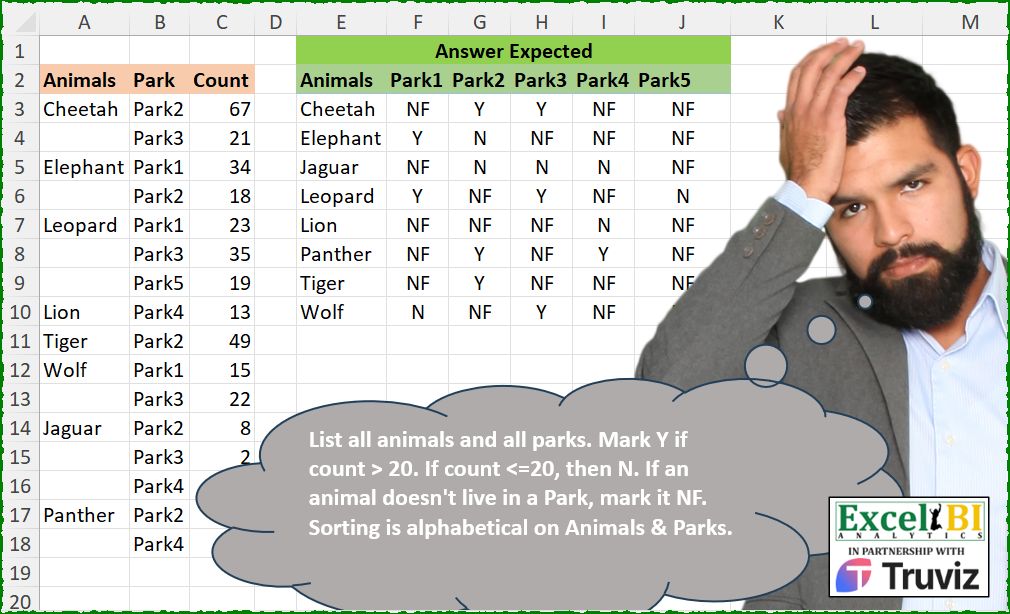
List all animals and all parks. Mark Y if count > 20. If count <=20, then N. If an animal doesn’t live in a Park, mark it NF. Sorting is alphabetical on Animals & Parks.
📌 Challenge Details and Links
ExcelBI Excel Challenge Number: 586
Challenge Difficulty: ⭐️⭐️
📥Download Sample File
📥Link to the solutions on LinkedIn
Solving the challenge of Animal Park Presence Matrix with Power Query
Power Query solution 1 for Animal Park Presence Matrix, proposed by Kris Jaganah:
let
  A = Excel.CurrentWorkbook(){[Name = "Table1"]}[Content],
  B = Table.FillDown(A, {"Animals"}),
  C = Table.Pivot(B, List.Sort(List.Distinct(B[Park])), "Park", "Count"),
  D = Table.TransformColumns(
    C,
    {},
    each try if _ = null then "NF" else if _ < 21 then "N" else "Y" otherwise _
  )
in
  D
Power Query solution 2 for Animal Park Presence Matrix, proposed by Aditya Kumar Darak 🇮🇳:
let
  Source = Excel.CurrentWorkbook(){[Name = "data"]}[Content],
  Fill = Table.FillDown(Source, {"Animals"}),
  Return = Table.Pivot(
    Fill,
    List.Sort(List.Distinct(Fill[Park])),
    "Park",
    "Count",
    each if _{0}? = null then "NF" else if _{0} > 20 then "Y" else "N"
  )
in
  Return
Power Query solution 4 for Animal Park Presence Matrix, proposed by Alejandro Simón 🇵🇦 🇪🇸:
let
  Source = Excel.CurrentWorkbook(){[Name = "Table1"]}[Content],
  FD = Table.FillDown(Source, {"Animals"}),
  Pivot = Table.Pivot(FD, List.Sort(List.Distinct(FD[Park])), "Park", "Count"),
  Sol = Table.ReplaceValue(
    Pivot,
    each _,
    each _,
    (x, y, z) => if x = null then "NF" else if x > 20 then "Y" else "N",
    List.Skip(Table.ColumnNames(Pivot))
  )
in
  Sol
Power Query solution 5 for Animal Park Presence Matrix, proposed by Alejandro Simón 🇵🇦 🇪🇸:
let
 Source = Excel.CurrentWorkbook(){[Name="Table1"]}[Content],
 FD = Table.FillDown(Source,{"Animals"}),
 RV = Table.ReplaceValue(FD, each [Count], each if [Count]>20 then "Y" else "N",Replacer.ReplaceValue,{"Count"}),
 Sol = Table.Pivot(RV, List.Sort(List.Distinct(RV[Park])), "Park", "Count", each _{0}? ??"NF")
in
 Sol

Sin embargo, más sencillo sigue siendo el presentado por Aditya Kumar Darak 🇮🇳 👏👏👏
Power Query solution 6 for Animal Park Presence Matrix, proposed by Alejandro Simón 🇵🇦 🇪🇸:
let
  Source = Excel.CurrentWorkbook(){[Name = "Table1"]}[Content],
  FD = Table.FillDown(Source, {"Animals"}),
  Pivot = Table.Pivot(FD, List.Sort(List.Distinct(FD[Park])), "Park", "Count"),
  Col = List.Skip(Table.ColumnNames(Pivot)),
  Sol = Table.TransformColumns(
    Pivot,
    List.Transform(Col, each {_, each if _ = null then "NF" else if _ > 20 then "Y" else "N"})
  )
in
  Sol
Power Query solution 7 for Animal Park Presence Matrix, proposed by Abdallah Ally:
let
  Source = Excel.CurrentWorkbook(){[Name = "Table1"]}[Content],
  Fill = Table.FillDown(Source, {"Animals"}),
  Pivot = Table.Pivot(
    Fill,
    List.Distinct(List.Sort(Fill[Park])),
    "Park",
    "Count",
    each if List.Sum(_) = null then "NF" else if List.Sum(_) > 20 then "Y" else "N"
  ),
  Result = Table.Sort(Pivot, "Animals")
in
  Result
Power Query solution 8 for Animal Park Presence Matrix, proposed by Md. Zohurul Islam:
let
  Source = Excel.CurrentWorkbook(){[Name = "data"]}[Content],
  a = Table.FillDown(Source, {"Animals"}),
  b = Table.Sort(a, {{"Park", Order.Ascending}}),
  c = Table.AddColumn(b, "status", each if [Count] >= 20 then "Y" else "N"),
  d = Table.RemoveColumns(c, {"Count"}),
  e = Table.Pivot(d, List.Distinct(d[Park]), "Park", "status"),
  f = Table.ReplaceValue(
    e,
    null,
    "NF",
    Replacer.ReplaceValue,
    {"Park1", "Park2", "Park3", "Park4", "Park5"}
  )
in
  f
Power Query solution 9 for Animal Park Presence Matrix, proposed by Ramiro Ayala Chávez:
let
  S = Excel.CurrentWorkbook(){[Name = "Table1"]}[Content],
  a = Table.FillDown(S, {"Animals"}),
  b = Table.AddColumn(a, "A", each if [Count] > 20 then "Y" else "N")[[Animals], [Park], [A]],
  c = Table.Sort(b, {"Park", 0}),
  d = Table.Pivot(c, List.Distinct(c[Park]), "Park", "A"),
  Sol = Table.ReplaceValue(
    d,
    null,
    "NF",
    Replacer.ReplaceValue,
    {"Park1", "Park2", "Park3", "Park4", "Park5"}
  )
in
  Sol
Power Query solution 10 for Animal Park Presence Matrix, proposed by Luke Jarych:
let
  Source = Excel.CurrentWorkbook(){[Name = "Table1"]}[Content],
  Filled = Table.FillDown(Source, {"Animals"}),
  Add = Table.RemoveColumns(
    Table.AddColumn(Filled, "Count2", each if [Count] >= 20 then "Y" else "N"),
    {"Count"}
  ),
  Pivot = Table.Pivot(Add, List.Distinct(List.Sort(Add[Park])), "Park", "Count2"),
  Replaced = Table.ReplaceValue(
    Pivot,
    null,
    "NF",
    Replacer.ReplaceValue,
    {"Animals", "Park2", "Park3", "Park1", "Park5", "Park4"}
  )
in
  Replaced
Power Query solution 11 for Animal Park Presence Matrix, proposed by Robert Redden II:
let
  Source = Excel.CurrentWorkbook(){[Name = "tbl_Data"]}[Content],
  changeType = Table.TransformColumnTypes(
    Source,
    {{"Animals", type text}, {"Park", type text}, {"Count", Int64.Type}}
  ),
  replaceValues = Table.ReplaceValue(
    changeType,
    each [Count],
    each if [Count] < 20 then "N" else "Y",
    Replacer.ReplaceValue,
    {"Count"}
  ),
  fillDown = Table.FillDown(replaceValues, {"Animals"}),
  pivotParkColumn = Table.Pivot(
    fillDown,
    List.Distinct(List.Sort(fillDown[Park], Order.Ascending)),
    "Park",
    "Count"
  ),
  replaceNullwithNF = Table.ReplaceValue(
    pivotParkColumn,
    null,
    "NF",
    Replacer.ReplaceValue,
    {"Park1", "Park2", "Park3", "Park4", "Park5"}
  ),
  sortAnimalsAscending = Table.Sort(replaceNullwithNF, {{"Animals", Order.Ascending}})
in
  sortAnimalsAscending
Solving the challenge of Animal Park Presence Matrix with Excel
Excel solution 1 for Animal Park Presence Matrix, proposed by 🇰🇷 Taeyong Shin:
=LET(
    p,
    PIVOTBY(
        SCAN(
            ,
            A3:A18,
            LAMBDA(
                a,
                v,
                IF(
                    v>"",
                    v,
                    a
                )
            )
        ),
        B3:B18,
        IF(
            C3:C18>20,
            "Y",
            "N"
        ),
        SINGLE,
        ,
        0,
        ,
        0
    ),
    IFS(
        p>"",
        p,
        SEQUENCE(
            ROWS(
                p
            )
        )=1,
        A2,
        1,
        "NF"
    )
)
Excel solution 2 for Animal Park Presence Matrix, proposed by Kris Jaganah:
=LET(
    a,
    SCAN(
        "",
        A3:A18,
        LAMBDA(
            x,
            y,
            IF(
                y="",
                x,
                y
            )
        )
    ),
    b,
    B3:B18,
    c,
    IF(
        C3:C18<21,
        "N",
        "Y"
    ),
    d,
    SORT(
        UNIQUE(
            a
        )
    ),
    e,
    TOROW(
        SORT(
            UNIQUE(
                b
            )
        )
    ),
    VSTACK(
        HSTACK(
            "Animals",
            e
        ),
        HSTACK(
            d,
            XLOOKUP(
                d&e,
                a&b,
                c,
                "NF"
            )
        )
    )
)
Excel solution 3 for Animal Park Presence Matrix, proposed by Julian Poeltl:
=LET(
    A,
    A3:A18,
    P,
    B3:B18,
    C,
    C3:C18,
    S,
    SCAN(
        "",
        A,
        LAMBDA(
            A,
            B,
            IF(
                B="",
                A,
                B
            )
        )
    ),
    UA,
    SORT(
        UNIQUE(
            S
        )
    ),
    UP,
    TOROW(
        SORT(
            UNIQUE(
                P
            )
        )
    ),
    VSTACK(
        HSTACK(
            "Animal",
            UP
        ),
        HSTACK(
            UA,
            IF(
                XLOOKUP(
                    UA&UP,
                    S&P,
                    C,
                    0
                )>20,
                "Y",
                "NF"
            )
        )
    )
)
Excel solution 4 for Animal Park Presence Matrix, proposed by Timothée BLIOT:
=LET(A,SORT(A3:A18),B,B3:B18,C,C3:C18,D,SCAN("",A,LAMBDA(w,v,IF(v="",w,v))),E,IFERROR(--DROP(PIVOTBY(D,B,C,SUM,,0,,0),1,1),0), HSTACK(UNIQUE(D),IF(E>20,"Y","NF")))Excel solution 5 for Animal Park Presence Matrix, proposed by Duy Tùng:
=LET(
    a,
    PIVOTBY(
        SCAN(
            ,
            A3:A18,
            LAMBDA(
                x,
                v,
                IF(
                    v>0,
                    v,
                    x
                )
            )
        ),
        B3:B18,
        C3:C18,
        LAMBDA(
            x,
            @IF(
                x>20,
                "Y",
                "N"
            )
        ),
        ,
        0,
        ,
        0
    ),
    IF(
        a="",
        IF(
            TAKE(
                a,
                ,
                1
            )="",
            A2,
            "NF"
        ),
        a
    )
)
Excel solution 6 for Animal Park Presence Matrix, proposed by Sunny Baggu:
=LET(
 _f, SCAN("", A3:A18, LAMBDA(a, v, IF(v = "", a, v))),
 _u, SORT(TOCOL(A3:A18, 3)),
 _h, TOROW(SORT(UNIQUE(B3:B18))),
 _p, MAKEARRAY(
 ROWS(_u),
 COLUMNS(_h),
 LAMBDA(r, c,
 INDEX(
 LET(
 _v, BYCOL(
 (B3:B18 = _h) * (_f = INDEX(_u, r, 1)) * C3:C18,
 LAMBDA(a, SUM(a))
 ),
 IFS(_v = 0, "NF", _v > 20, "Y", _v <= 20, "N")
 ),
 c
 )
 )
 ),
 VSTACK(HSTACK(A2, _h), HSTACK(_u, _p))
)
Excel solution 7 for Animal Park Presence Matrix, proposed by Anshu Bantra:
=LET(
 data_, PIVOTBY(A2:A18, B2:B18, C2:C18, SUM, 1, 0, , 0),
 arr_, IFS(  ISNUMBER(data_), IF(data_ > 20, "Y", "N"),
 data_ = "", "NF",
 TRUE, data_
 ),
 MAKEARRAY(
 ROWS(arr_),
 COLUMNS(arr_),
 LAMBDA(x, y, IF(x * y = 1, "Animals", INDEX(arr_, x, y)))
 )
)
Excel solution 8 for Animal Park Presence Matrix, proposed by Md. Zohurul Islam:
=LET(
a,A3:A18,
park,B3:B18,
cnt,C3:C18,
animals,SCAN("",a,LAMBDA(x,y,IF(y="",x,y))),
unqPark,TOROW(SORT(UNIQUE(park))),
unqAnimal,SORT(UNIQUE(animals)),
b,unqAnimal&unqPark,
c,XLOOKUP(b,animals&park,cnt),
d,IF(c>20,"Y","N"),
e,IFNA(d,"NF"),
f,VSTACK(unqPark,e),
g,VSTACK("Animals",unqAnimal),
result,HSTACK(g,f),
result)
Excel solution 9 for Animal Park Presence Matrix, proposed by Hamidi Hamid:
=LET(f,LAMBDA(z,SCAN(0,z,LAMBDA(a,b,IF(b>0,b,a)))),x,PIVOTBY(f(A3:A18),B3:B18,C3:C18,SUM,,0,,0),y,DROP(x,1,1),HSTACK(SORT(UNIQUE(f(A2:A18))),VSTACK(TRANSPOSE(SORT(UNIQUE(B3:B18))),IF(y="","NF",IF(y>20,"Y","N")))))Excel solution 10 for Animal Park Presence Matrix, proposed by Jaroslaw Kujawa:
=LET(y;B3:C18;xx;DROP(REDUCE("";A3:A18;LAMBDA(a;x;VSTACK(a;IF(x<>"";x;TAKE(a;-1)))));1);z;HSTACK(xx;y);down;UNIQUE(SORT(TAKE(z;;1)));right;TOROW(UNIQUE(SORT(CHOOSECOLS(z;2))));mx;IFNA(IF(INDEX(z;MATCH(down&right;TAKE(z;;1)&CHOOSECOLS(z;2);0);3)>20;"Y";"N");"NF");HSTACK(VSTACK("Animals";down);VSTACK(right;mx)))Excel solution 11 for Animal Park Presence Matrix, proposed by JvdV -:
=SCAN(
    ,
    PIVOTBY(
        SCAN(
            ,
            A3:A18,
            LAMBDA(
                x,
                y,
                IF(
                    y>0,
                    y,
                    x
                )
            )
        ),
        B3:B18,
        C3:C18,
        N,
        ,
        0,
        ,
        0
    ),
    LAMBDA(
        a,
        b,
        IFS(
            b>"a",
            b,
            b="",
            "NF",
            b<20,
            "N",
            b,
            "Y"
        )
    )
)
Excel solution 12 for Animal Park Presence Matrix, proposed by Imam Hambali:
=LET(
a, SCAN(,A3:A18, LAMBDA(x,y, IF(y="",y&x,y))),
v, IF(C3:C18>20,"Y","N"),
pb, PIVOTBY(a,B3:B18,v,ARRAYTOTEXT,0,0,,0),
vp, DROP(pb,1,1),
HSTACK(VSTACK("Animals", DROP(TAKE(pb,,1),1)), VSTACK(DROP(TAKE(pb,1),,1), IF(vp="","NF",vp)))
)
Excel solution 13 for Animal Park Presence Matrix, proposed by Philippe Brillault:
=LET(

    cc,
    CHOOSECOLS,

    t,
    HSTACK(
        SCAN(
            0,
            cc(
                _T,
                1
            ),
            LAMBDA(
                c,
                t,
                IF(
                    LEN(
                        t
                    )>0,
                    t,
                    c
                )
            )
        ),
        cc(
            _T,
            2
        ),
        IF(
            cc(
                _T,
                3
            )>20,
            "Y",
            "N"
        )
    ),

    p,
    PIVOTBY(
        cc(
            t,
            1
        ),
        cc(
            t,
            2
        ),
        cc(
            t,
            3
        ),
        ARRAYTOTEXT,
        0,
        0,
        ,
        0
    ),

    SCAN(
        "",
        IF(
            LEN(
                p
            )=0,
            "NF",
            p
        ),
        LAMBDA(
            c,
            t,
            IF(
                c="",
                "Animals",
                t
            )
        )
    )
)
Excel solution 14 for Animal Park Presence Matrix, proposed by Stefan Alexandrov:
=LET(_animals,A3:A18,
_1st,IF(_animals="",OFFSET(_animals,-1,0),_animals),
_2nd,IF(_1st=0,OFFSET(_animals,-2,0),_1st),
_table,HSTACK(_2nd,B3:C18),
_pivot,PIVOTBY(CHOOSECOLS(_table,1),CHOOSECOLS(_table,2),CHOOSECOLS(_table,3),SUM,,0,,0),
_values,IF(ISNUMBER(_pivot),
 SWITCH(TRUE(),
 &_pivot>20,"Y",
 _pivot<=20,"N"),
 MAP(_pivot,LAMBDA(x,IF(x="","NF",x)))),
_header,SUBSTITUTE(CHOOSEROWS(_values,1),"NF","Animals"),
VSTACK(_header,DROP(_values,1))
)
Solving the challenge of Animal Park Presence Matrix with Python
Python solution 1 for Animal Park Presence Matrix, proposed by Konrad Gryczan, PhD:
import pandas as pd
path = "586 Lookup.xlsx"
input = pd.read_excel(path, usecols="A:C", skiprows=1, nrows=16)
test = pd.read_excel(path, usecols="E:J", skiprows=1, nrows=8).rename(columns=lambda x: x.split('.')[0])
input['Animals'] = input['Animals'].ffill()
input['Count'] = input['Count'].apply(lambda x: 'Y' if x > 20 else 'N')
result = input.pivot(index='Animals', columns='Park', values='Count').fillna('NF')
result = result.reset_index()
result.columns.name = None
print(result.equals(test)) # True
Python solution 2 for Animal Park Presence Matrix, proposed by Artur Pilipczuk:
import polars as pl
def set_value(col:pl.Series)->pl.Series:
 pl.when(col>20).then(1).when(col>0).then(0).when(0).then(-1)
df=pl.read_excel(r"Excel_Challenge_586 - Lookup.xlsx",sheet_name="Sheet1",has_header=True,columns="A:C")
df.columns=df.row(0)
df=(df[1:]
 .with_columns(pl.col("Animals").fill_null(strategy="forward"),
 pl.col("Count").cast(pl.Int64),
 )
 .pivot(on="Park",index="Animals",aggregate_function=pl.sum("Count"))
)
for col in df.columns[1:]:

 df=(df.with_columns(pl.when(pl.col(col)>20).then(pl.lit("Y")).when(pl.col(col)>0).then(pl.lit("N")).otherwise(pl.lit("NF")).alias(col))
 .select([df.columns[0]] + sorted([x for x in df.columns[1:]]))
 .sort(pl.col(df.columns[0]))
 )
print(df)
Solving the challenge of Animal Park Presence Matrix with Python in Excel
Python in Excel solution 1 for Animal Park Presence Matrix, proposed by Alejandro Campos:
df = xl("A2:C18", headers=True).ffill()
animals, parks = sorted(df['Animals'].unique()), sorted(df['Park'].unique())
animal_park_count = {a: {p: 'NF' for p in parks} for a in animals}
for _, r in df.iterrows(): animal_park_count[r['Animals']][r['Park']] = 'Y' if r['Count'] > 20 else 'N'
result_df = pd.DataFrame(animal_park_count).T[parks].reset_index().rename(columns={'index': 'Animals'})
result_df
Python in Excel solution 2 for Animal Park Presence Matrix, proposed by Anshu Bantra:
def transform_value(x: int) -> str:
 return  'NF' if x == 0 else
 'Y'  if x > 20 else
 'N'
df=xl("A2:C18", headers=True).ffill()
df = df.pivot_table(index='Animals', columns='Park', values='Count').fillna(0)
df = df.applymap(lambda x: transform_value(x))
df.columns.name=None
df.reset_index(inplace=True)
df
Solving the challenge of Animal Park Presence Matrix with R
R solution 1 for Animal Park Presence Matrix, proposed by Konrad Gryczan, PhD:
library(tidyverse)
library(readxl)
path = "Excel/586 Lookup.xlsx"
input = read_excel(path, range = "A2:C18")
test = read_excel(path, range = "E2:J10")
result = input %>%
 fill(Animals, .direction = "down") %>%
 mutate(Count = ifelse(Count > 20, "Y", "N")) %>%
 pivot_wider(names_from = Park, values_from = Count, values_fill = "NF") %>%
 arrange(Animals) %>%
 select(Animals, Park1, Park2, Park3, Park4, Park5)
all.equal(result, test)
#> [1] TRUE
&&