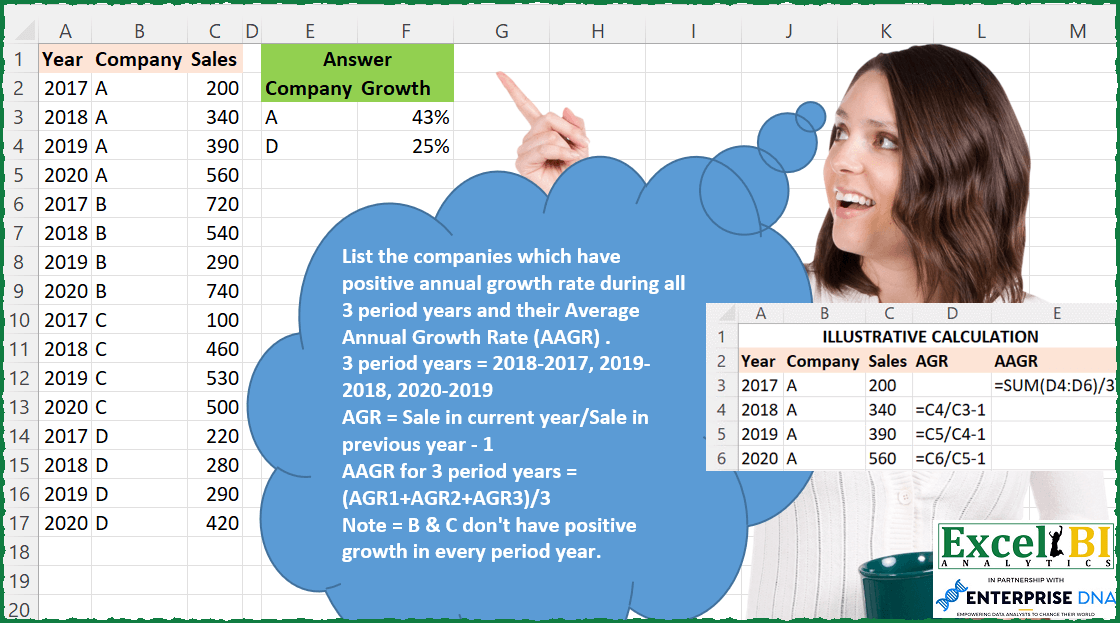
List the companies which have positive annual growth rate during all 3 period years and their Average Annual Growth Rate (AAGR) . 3 period years = 2018-2017, 2019-2018, 2020-2019 Annual Growth Rate (AGR) = Sale in current year/Sale in previous year – 1 Average Annual Growth Rate (AAGR) for 3 period years = (AGR1+AGR2+AGR3)/3 Note = B & C don’t have positive growth in every period year. Hence, discarded.
📌 Challenge Details and Links
ExcelBI Excel Challenge Number: 99
Challenge Difficulty: ⭐️⭐️⭐️
📥Download Sample File
📥Link to the solutions on LinkedIn
Solving the challenge of Companies with Positive Growth with Power Query
Power Query solution 1 for Companies with Positive Growth, proposed by Bo Rydobon 🇹🇭:
let
  Source = Excel.CurrentWorkbook(){[Name = "Table1"]}[Content],
  Group = Table.SelectRows(
    Table.Group(
      Source,
      {"Company"},
      {
        "Growth",
        each
          let
            a = List.Transform(
              List.Zip({List.Skip([Sales], 1), List.RemoveLastN([Sales], 1)}),
              each _{0} / _{1} - 1
            )
          in
            if List.ContainsAll({true}, List.Transform(a, each _ > 0)) then List.Average(a) else 0
      }
    ),
    each ([Growth] > 0)
  )
in
  Group
Power Query solution 2 for Companies with Positive Growth, proposed by Alejandro Simón 🇵🇦 🇪🇸:
let
  Source = Excel.CurrentWorkbook(){[Name = "Table1"]}[Content],
  SortedRows = Table.Sort(Source, {{"Company", Order.Ascending}, {"Year", Order.Ascending}}),
  Grouped = Table.Group(
    SortedRows,
    {"Company"},
    {
      {
        "Growth",
        each
          let
            a = [[Year], [Sales]],
            b = Table.AddIndexColumn(a, "Idx"),
            c = Table.Skip(
              Table.AddColumn(
                b,
                "AAGR",
                each try (b[Sales]{[Idx]} / b[Sales]{[Idx] - 1}) - 1 otherwise 0
              )
            )
          in
            if Table.MatchesAllRows(c, each [AAGR] >= 0) then
              Number.Round(List.Average(c[AAGR]), 2)
            else
              null,
        Percentage.Type
      }
    }
  ),
  Solucion = Table.SelectRows(Grouped, each ([Growth] <> null))
in
  Solucion
Power Query solution 3 for Companies with Positive Growth, proposed by Luan Rodrigues:
let
  Fonte = Tabela1,
  a = Table.SelectRows(Fonte, each ([Company] = "A" or [Company] = "D")),
  Index = Table.AddIndexColumn(a, "Índice", 1, 1, Int64.Type),
  c = Table.AddColumn(
    Index,
    "Personalizar",
    each [
      a = try Index{[Índice]}[Year] otherwise [Year],
      b = try Index{[Índice]}[Sales] otherwise [Sales]
    ]
  ),
  d = Table.ExpandRecordColumn(c, "Personalizar", {"a", "b"}, {"a", "b"}),
  e = Table.SelectRows(
    Table.AddColumn(d, "Personalizar", each Number.Mod([Índice], 4)),
    each ([Personalizar] <> 0)
  ),
  f = Table.AddColumn(e, "Personalizar1", each [b] / [Sales] - 1),
  Result = Table.Group(
    f,
    {"Company"},
    {{"Growth", each Number.Round(List.Average([Personalizar1]), 2), Percentage.Type}}
  )
in
  Result
Power Query solution 4 for Companies with Positive Growth, proposed by Brian Julius:
let
  Source = Excel.CurrentWorkbook(){[Name = "Table1"]}[Content],
  AddIndex = Table.AddIndexColumn(Source, "Index", 0, 1, Int64.Type),
  AddInterims = Table.AddColumn(
    AddIndex,
    "Interims",
    each [
      PrevCompany = try AddIndex[Company]{[Index] - 1} otherwise null,
      PrevSales   = if [Company] = PrevCompany then AddIndex[Sales]{[Index] - 1} else null,
      YOYSales    = ([Sales] / PrevSales) - 1,
      Sign        = try if YOYSales >= 0 then 1 else - 1 otherwise null
    ]
  ),
  AddSigns = Table.AddColumn(AddInterims, "Signs", each [Interims][Sign]),
  AddYOY = Table.AddColumn(AddSigns, "YOY", each [Interims][YOYSales]),
  ReType = Table.TransformColumnTypes(AddYOY, {{"YOY", Percentage.Type}}),
  Group = Table.Group(
    ReType,
    {"Company"},
    {
      {"TotSigns", each List.Sum([Signs]), type nullable number},
      {"Growth", each List.Average([YOY]), type nullable number}
    }
  ),
  Filter = Table.SelectRows(Group, each ([TotSigns] = 3)),
  Clean = Table.RemoveColumns(
    Table.TransformColumnTypes(Filter, {{"Growth", Percentage.Type}}),
    "TotSigns"
  )
in
  Clean
Power Query solution 5 for Companies with Positive Growth, proposed by Bhavya Gupta:
let
  Source = Excel.CurrentWorkbook(){[Name = "Table1"]}[Content],
  Sorted = Table.Sort(Source, {{"Company", Order.Ascending}, {"Year", Order.Ascending}}),
  FnAAGR = (S as list) =>
    let
      GR   = List.Transform(List.Zip({List.Skip(S), List.RemoveLastN(S, 1)}), each _{0} / _{1} - 1),
      AAGR = if List.MatchesAll(GR, each _ >= 0) then Number.Round(List.Average(GR), 4) else "No"
    in
      AAGR,
  Grouped = Table.Group(Sorted, {"Company"}, {{"Growth", each FnAAGR([Sales])}}),
  Filtered = Table.SelectRows(Grouped, each ([Growth] <> "No")),
  ExpectedOutput = Table.TransformColumnTypes(Filtered, {{"Growth", Percentage.Type}})
in
  ExpectedOutput
Power Query solution 6 for Companies with Positive Growth, proposed by Victor Wang:
let
  Source = Excel.CurrentWorkbook(){[Name = "Table1"]}[Content],
  Recs = List.Split(Table.ToRecords(Source), 4),
  Transform = List.Transform(
    Recs,
    each
      let
        l = List.Transform(
          List.Positions(_),
          (a) => try _{a + 1}[Sales] / _{a}[Sales] - 1 otherwise 1
        )
      in
        if List.MatchesAll(l, each _ > 0) then
          [Company = _{0}[Company], Growth = List.Sum(List.FirstN(l, 3)) / 3]
        else
          null
  ),
  Result = Table.FromRecords(List.RemoveNulls(Transform))
in
  Result
Power Query solution 7 for Companies with Positive Growth, proposed by Jan Willem Van Holst:
let
  Source = Table.FromRows(
    Json.Document(
      Binary.Decompress(
        Binary.FromText(
          "Zc67DcAgDEXRXagpjGN+ZRK2QOy/RrAFSE8p3Bzhi3t3TCE77+45TOSGNyqLLjlUN9VNTItiOq+09czJDC2liC0lxpYtCrTeOQHvUpIELaV4QcuIoNX0R7zLqECr/e9SEl0cHw==",
          BinaryEncoding.Base64
        ),
        Compression.Deflate
      )
    ),
    let
      _t = ((type nullable text) meta [Serialized.Text = true])
    in
      type table [Year = _t, Company = _t, Sales = _t]
  ),
  #"Changed Type" = Table.TransformColumnTypes(
    Source,
    {{"Year", Int64.Type}, {"Sales", Int64.Type}}
  ),
  #"Grouped Rows" = Table.Group(
    #"Changed Type",
    {"Company"},
    {
      {
        "data",
        each
          let
            myList = [Sales],
            result = List.Generate(
              () => [i = 0, cum = 0],
              each [i] <= 3,
              each [i = [i] + 1, cum = (myList{i} / myList{[i]}) - 1],
              each [cum]
            )
          in
            List.RemoveFirstN(result)
      }
    }
  ),
  #"Filtered Rows" = Table.SelectRows(#"Grouped Rows", each (List.MatchesAll([data], each _ > 0))),
  Result = Table.TransformColumns(
    #"Filtered Rows",
    {{"data", each Number.Round(List.Sum(_) / 3, 2), Percentage.Type}}
  )
in
  Result
Solving the challenge of Companies with Positive Growth with Excel
Excel solution 1 for Companies with Positive Growth, proposed by Bo Rydobon 🇹🇭:
=LET(b,B2:B17,u,UNIQUE(b),m,MAP(u,LAMBDA(v,LET(d,FILTER(C2:C17,b=v),e,DROP(DROP(d,1)/d,-1),AND(e>1)*AVERAGE(e-1)))),
FILTER(HSTACK(u,m),m))
Excel solution 2 for Companies with Positive Growth, proposed by Bo Rydobon 🇹🇭:
=LET(c,B2:B17,s,C2:C17,DROP(REDUCE(0,UNIQUE(c),
LAMBDA(a,v,LET(y,DROP(FILTER(DROP(s,1)/s/(c=DROP(c,1)),c=v),-1)-1,IF(AND(y>0),VSTACK(a,HSTACK(v,AVERAGE(y))),a)))),1))
Excel solution 3 for Companies with Positive Growth, proposed by John V.:
=LET(s,C2:C17,c,B2:B17,u,UNIQUE(c),r,MAP(u,LAMBDA(x,LET(a,DROP(FILTER(VSTACK(0,DROP(s,1)/DROP(s,-1)-1),c=x),1),IF(AND(a>0),AVERAGE(a),)))),FILTER(HSTACK(u,r),r))Excel solution 4 for Companies with Positive Growth, proposed by محمد حلمي:
=LET(
r,B2:B17,
u,UNIQUE(r),
v,MAP(u,LAMBDA(b,LET(
e,FILTER(C2:C17,r=b),
c,DROP(e,-1),
i,DROP(e,1)-c,IF(AND((i)>0),
ROUND(AVERAGE( (i)/c),2))))),
FILTER(HSTACK(u,v),v))
Excel solution 5 for Companies with Positive Growth, proposed by 🇰🇷 Taeyong Shin:
=LET(
 cmp, B2:B17,
 sales, C2:C17,
 y, A2:A17,
 u, UNIQUE(cmp),
 g, IFNA(sales / XLOOKUP(cmp & y - 1, cmp & y, sales) - 1, ""),
 d, MAP(u, LAMBDA(m,
 LET(
 fg, FILTER(g, cmp = m),
 IF(AND(fg > 0), AVERAGE(fg))
 )
 )),
 FILTER(HSTACK(u, d), d)
)
Excel solution 6 for Companies with Positive Growth, proposed by Kris Jaganah:
=LET(a,A2:A17,b,B2:B17,c,C2:C17,d,IF(a<>2017,c/OFFSET(c,-1,0)-1,0),e,UNIQUE(b),f,BYROW(e,LAMBDA(x,SUM((--(d>0)*(b=x))))),g,BYROW(e,LAMBDA(y,SUM(FILTER(d,b=y)/3))),FILTER(HSTACK(e,g),f=3))Excel solution 7 for Companies with Positive Growth, proposed by Julian Poeltl:
=LET(C,B2:B17,S,C2:C17,U,UNIQUE(C),R,MAP(U,LAMBDA(A,LET(F,FILTER(S,A=C),G,DROP((DROP(F,1)-F)/F,-1),IF(MIN(G)>0,AVERAGE(G),X)))),FILTER(HSTACK(U,R),ISNUMBER(R)))Excel solution 8 for Companies with Positive Growth, proposed by Aditya Kumar Darak 🇮🇳:
=LET(
 _d, A2:C17,
 _co, INDEX(_d, 0, 2),
 _uco, UNIQUE(_co),
 _c, MAP(
 _uco,
 LAMBDA(a,
 LET(
 f, FILTER(_d, _co = a),
 agr, DROP(f, 1, 2) / DROP(f, -1, 2) - 1,
 r, IF(AND(agr > 0), AVERAGE(agr)),
 r
 )
 )
 ),
 _r, FILTER(HSTACK(_uco, _c), _c <> FALSE),
 _r
)
Excel solution 9 for Companies with Positive Growth, proposed by Timothée BLIOT:
=LET(Y,A2:A17,C,B2:B17,S,C2:C17,P,PIVOTBY(C,Y,S,SUM),
AGR,MAKEARRAY(ROWS(P)-1,COLUMNS(P)-1,LAMBDA(a,b,IF((a>1)*(b>2),INDEX(P,a,b)/INDEX(P,a,b-1)-1,0))),
AAGR,BYROW(AGR,LAMBDA(a,SUM(a)/3)),
FILTER(HSTACK(TAKE(INDEX(P,,1),ROWS(P)-1),AAGR),BYROW(IF(AGR>0,1,""),LAMBDA(a,--(SUM(a)=3) ))) )
Excel solution 10 for Companies with Positive Growth, proposed by Charles Roldan:
=LET(Year,A2:A17,Company,B2:B17,Sales,C2:C17,
Mat,WRAPROWS(Sales,COUNT(UNIQUE(Year))),
Growth,BYROW(DROP(Mat,,1)/DROP(Mat,,-1)-1,
LAMBDA(x,IF(MIN(x)>0,AVERAGE(x)))),
FILTER(HSTACK(UNIQUE(Company),TEXT(Growth,"#%")),Growth))
Solving the challenge of Companies with Positive Growth with Python
Solving the challenge of Companies with Positive Growth with Python in Excel
Python in Excel solution 1 for Companies with Positive Growth, proposed by Alejandro Campos:
df = xl("A1:C17", headers=True)
results = pd.DataFrame([
 {'Company': c, 'AAGR': g['Sales'].pct_change().mean()}
 for c, g in df.groupby('Company') if (g['Sales'].pct_change().dropna() > 0).all()])
Solving the challenge of Companies with Positive Growth with DAX
DAX solution 1 for Companies with Positive Growth, proposed by Zoran Milokanović:
EVALUATE
GROUPBY(
 FILTER(
 ADDCOLUMNS(Input,
 "G", VAR P = SELECTCOLUMNS(OFFSET(-1, DISTINCT(ALLSELECTED(Input)), ORDERBY(Input[Year]), PARTITIONBY(Input[Company])), Input[Sales]) RETURN DIVIDE(Input[Sales] - P, P),
 "C", COUNTROWS(FILTER(WINDOW(2, ABS, -1, ABS, DISTINCT(ALLSELECTED(Input)), ORDERBY(Input[Year]), PARTITIONBY(Input[Company])), SELECTCOLUMNS(OFFSET(-1, DISTINCT(ALLSELECTED(Input)), ORDERBY(Input[Year]), PARTITIONBY(Input[Company])), Input[Sales]) < Input[Sales]))
 ),
 AND([C] = 3, NOT ISBLANK([G]))
 ),
 Input[Company],
 "Growth", AVERAGEX(CURRENTGROUP(), [G])
)
Solving the challenge of Companies with Positive Growth with SQL
SQL solution 1 for Companies with Positive Growth, proposed by Zoran Milokanović:
SELECT
 T.COMPANY
,TO_CHAR(ROUND(AVG((T.SALES - T.SALES_PREVIOUS) / T.SALES_PREVIOUS) * 100)) || '%' AS GROWTH
FROM
(
 SELECT
 D.YEAR
 , D.COMPANY
 ,D.SALES
 ,LAG(D.SALES) OVER (PARTITION BY D.COMPANY ORDER BY D.YEAR) AS SALES_PREVIOUS
 FROM DATA D
) T
WHERE
 T.SALES_PREVIOUS IS NOT NULL
GROUP BY
 T.COMPANY
HAVING
 MIN(SIGN((T.SALES - T.SALES_PREVIOUS) / T.SALES_PREVIOUS)) /*GROWTH_TREND*/= 1
ORDER BY
 1
;
&&&