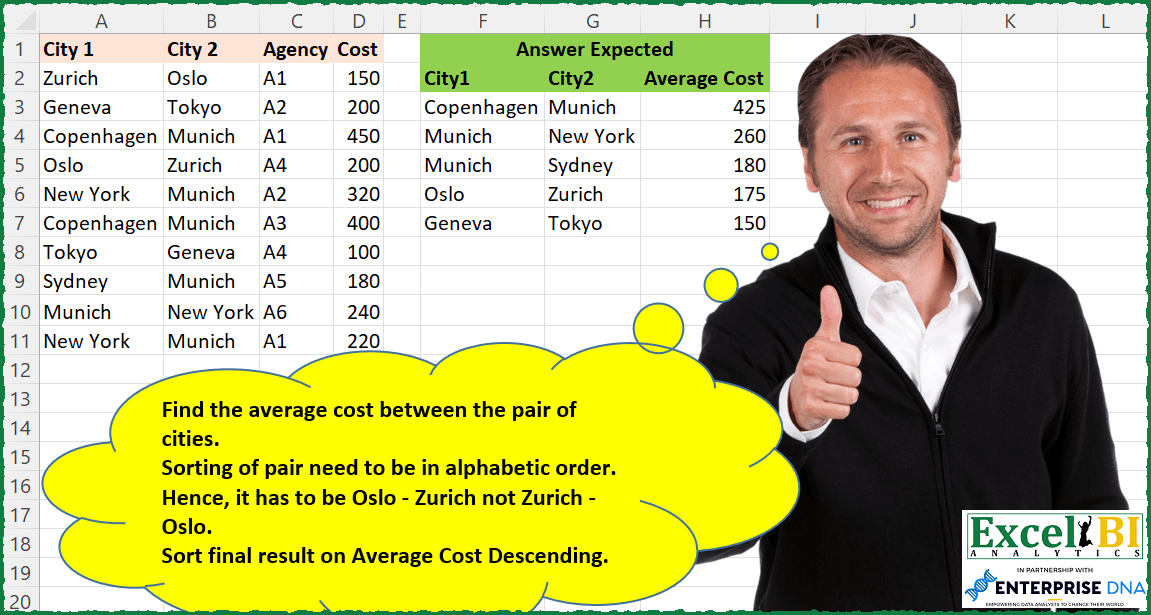
Find the average cost between the pair of cities. Sorting of pair needs to be in alphabetic order. Hence, it has to be Oslo – Zurich not Zurich – Oslo. Sort final result on Average Cost Descending.
📌 Challenge Details and Links
ExcelBI Excel Challenge Number: 92
Challenge Difficulty: ⭐️⭐️
📥Download Sample File
📥Link to the solutions on LinkedIn
Solving the challenge of Avg Cost Between City Pairs with Power Query
Power Query solution 1 for Avg Cost Between City Pairs, proposed by Bo Rydobon 🇹🇭:
let
  Source = Excel.CurrentWorkbook(){[Name = "Table1"]}[Content],
  SortCol = Table.FromRows(
    List.Transform(Table.ToRows(Source), each List.Sort(List.FirstN(_, 2)) & List.LastN(_, 1)),
    {"City 1", "City 2", "Cost"}
  ),
  Group = Table.Sort(
    Table.Group(SortCol, {"City 1", "City 2"}, {{"Average Cost", each List.Average([Cost])}}),
    {{"Average Cost", 1}}
  )
in
  Group
Power Query solution 2 for Avg Cost Between City Pairs, proposed by Alejandro Simón 🇵🇦 🇪🇸:
let
 Source = Excel.CurrentWorkbook(){[Name="Table1"]}[Content],
 #"Added Custom" = Table.AddColumn(Source, "Custom", each List.Sort({[City 1],[City 2]})),
 #"Grouped Rows" = Table.Group(#"Added Custom", {"Custom"}, {{"Average Cost", each List.Average([Cost]), type number}}),
 #"Sorted Rows" = Table.Sort(#"Grouped Rows",{{"Average Cost", Order.Descending}}),
 #"Extracted Values" = Table.TransformColumns(#"Sorted Rows", {"Custom", each Text.Combine(List.Transform(_, Text.From), ","), type text}),
 #"Split Column by Delimiter" = Table.SplitColumn(#"Extracted Values", "Custom", Splitter.SplitTextByDelimiter(",", QuoteStyle.Csv), {"City 1", "City 2"})
in
 #"Split Column by Delimiter"

y.........
Power Query solution 3 for Avg Cost Between City Pairs, proposed by Alejandro Simón 🇵🇦 🇪🇸:
continua........
#"Merged Columns1" = Table.CombineColumns(Table.TransformColumnTypes(#"Extracted Text Before Delimiter1", {{"Index.1", type text}}, "es-PA"),{"Attribute", "Index.1"},Combiner.CombineTextByDelimiter("", QuoteStyle.None),"Merged"),
 #"Pivoted Column" = Table.Pivot(#"Merged Columns1", List.Distinct(#"Merged Columns1"[Merged]), "Merged", "Value"),
 #"Grouped Rows" = Table.Group(#"Pivoted Column", {"City1", "City2"}, {{"Average Costs", each List.Average([Cost0]), type number}}),
 #"Sorted Rows" = Table.Sort(#"Grouped Rows",{{"Average Costs", Order.Descending}})
in
 #"Sorted Rows"
Power Query solution 4 for Avg Cost Between City Pairs, proposed by Luan Rodrigues:
let
  Fonte = Data,
  a = Table.AddColumn(
    Fonte,
    "City",
    each Text.Combine(List.Transform(List.Sort({[City 1], [City 2]}), Text.From), "|")
  )[[City], [Cost]],
  b = Table.Sort(
    Table.Group(a, {"City"}, {{"Average Cost", each List.Average([Cost]), type number}}),
    {{"Average Cost", Order.Descending}}
  ),
  Result = Table.SplitColumn(b, "City", Splitter.SplitTextByDelimiter("|", QuoteStyle.Csv), 2)
in
  Result
Power Query solution 5 for Avg Cost Between City Pairs, proposed by Brian Julius:
let
  Source = Excel.CurrentWorkbook(){[Name = "Table1"]}[Content],
  SortedPair = Table.AddColumn(
    Source,
    "SortedPair",
    each Text.Combine(List.Sort({[City 1], [City 2]}, Order.Ascending), "-")
  ),
  Group = Table.Sort(
    Table.Group(
      SortedPair,
      {"SortedPair"},
      {{"Average Cost", each List.Average([Cost]), type number}}
    ),
    {{"Average Cost", Order.Descending}, {"SortedPair", Order.Ascending}}
  ),
  Split = Table.SplitColumn(
    Group,
    "SortedPair",
    Splitter.SplitTextByEachDelimiter({"-"}, QuoteStyle.Csv, false),
    {"City 1", "City 2"}
  )
in
  Split
Power Query solution 6 for Avg Cost Between City Pairs, proposed by Bhavya Gupta:
let
  Source = Excel.CurrentWorkbook(){[Name = "Table1"]}[Content],
  Custom = Table.FromColumns(
    List.Zip(List.Transform(Table.ToRows(Source[[City 1], [City 2]]), List.Sort)) & {Source[Cost]},
    {"City 1", "City 2", "Cost"}
  ),
  Grouped = Table.Group(
    Custom,
    {"City 1", "City 2"},
    {{"Average Cost", each List.Average([Cost]), type number}}
  ),
  Sorted = Table.Sort(Grouped, {{"Average Cost", Order.Descending}})
in
  Sorted
Power Query solution 7 for Avg Cost Between City Pairs, proposed by 🇮🇷 Navid Esmaeilzadeh اسماعیل زاده:
let
  Source = Excel.CurrentWorkbook(){[Name = "Table1"]}[Content],
  #"Removed Columns" = Table.RemoveColumns(Source, {"Agency"}),
  #"Added Custom" = Table.AddColumn(
    #"Removed Columns",
    "Custom",
    each List.Sort({[City 1], [City 2]})
  ),
  #"Extracted Values" = Table.TransformColumns(
    #"Added Custom",
    {"Custom", each Text.Combine(List.Transform(_, Text.From), "-"), type text}
  ),
  #"Removed Other Columns" = Table.SelectColumns(#"Extracted Values", {"Custom", "Cost"}),
  #"Grouped Rows" = Table.Group(
    #"Removed Other Columns",
    {"Custom"},
    {{"Count", each List.Average([Cost]), type number}}
  ),
  #"Split Column by Delimiter" = Table.SplitColumn(
    #"Grouped Rows",
    "Custom",
    Splitter.SplitTextByDelimiter("-", QuoteStyle.Csv),
    {"Custom.1", "Custom.2"}
  ),
  #"Changed Type" = Table.TransformColumnTypes(
    #"Split Column by Delimiter",
    {{"Custom.1", type text}, {"Custom.2", type text}}
  ),
  #"Renamed Columns" = Table.RenameColumns(
    #"Changed Type",
    {{"Custom.1", "City.1"}, {"Custom.2", "City.2"}, {"Count", "Average Cost"}}
  )
in
  #"Renamed Columns"
Power Query solution 8 for Avg Cost Between City Pairs, proposed by Matthias Friedmann:
let
 Source = Excel.CurrentWorkbook(){[Name="CityCost"]}[Content],
 #"Replaced Value" = Table.ReplaceValue(Source,each [City 1],each [City 2],(a,b,c)=> if b < c then a else List.RemoveItems({b, c}, {a}){0},{"City 1", "City 2"}),
 #"Grouped Rows" = Table.Group(#"Replaced Value", {"City 1", "City 2"}, {{"Average Cost", each List.Average([Cost]), type number}}),
 #"Sorted Rows" = Table.Sort(#"Grouped Rows",{{"Average Cost", Order.Descending}})
in
 #"Sorted Rows"


Is one step better then 2 steps (e.g. Brian Julius) or 3 steps (step by step => s. comment)? No! But it is a very useful technique!

Check out explanations and other use cases for the replacement step:
https://www.linkedin.com/posts/matthiasfriedmann_powerquery-excel-powerbi-activity-7010265815132348416-9Zwc

https://www.linkedin.com/pulse/adjust-multiple-columns-power-query-another-column-matthias-friedmann/
Power Query solution 9 for Avg Cost Between City Pairs, proposed by Rafael González B.:
let
  Source = Excel.CurrentWorkbook(){[Name = "Table1"]}[Content],
  #"Removed AgencyColumn" = Table.RemoveColumns(Source, {"Agency"}),
  SortInList = Table.AddColumn(
    #"Removed AgencyColumn",
    "CitiesLists",
    each List.Sort({[City 1], [City 2]})
  ),
  GroupByList = Table.Group(
    SortInList,
    {"CitiesLists"},
    {{"Ave", each List.Average([Cost]), type number}}
  ),
  CombineTextEachExpadedList = Table.TransformColumns(
    GroupByList,
    {"CitiesLists", each Text.Combine(List.Transform(_, Text.From), "|"), type text}
  ),
  SplitColumnCities = Table.SplitColumn(
    CombineTextEachExpadedList,
    "CitiesLists",
    Splitter.SplitTextByDelimiter("|", QuoteStyle.Csv),
    {"From", "To"}
  )
in
  SplitColumnCities
Power Query solution 10 for Avg Cost Between City Pairs, proposed by Mahmoud Bani Asadi:
let
  Source = Excel.CurrentWorkbook(){[Name = "Table1"]}[Content],
  MergedCol = Table.CombineColumns(
    Source,
    {"City 1", "City 2"},
    each Text.Combine(List.Sort(_), "-"),
    "City"
  ),
  Group = Table.Group(
    MergedCol,
    {"City"},
    {{"Average Cost", each List.Average([Cost]), type number}}
  ),
  Sort = Table.Sort(Group, {{"Average Cost", Order.Descending}}),
  SplitColByDelim = Table.SplitColumn(
    Sort,
    "City",
    Splitter.SplitTextByDelimiter("-", QuoteStyle.Csv),
    {"City.1", "City.2"}
  )
in
  SplitColByDelim
Power Query solution 11 for Avg Cost Between City Pairs, proposed by Sergei Baklan:
let
  Source = Excel.CurrentWorkbook(){[Name = "data"]}[Content],
  #"Promoted Headers" = Table.PromoteHeaders(Source, [PromoteAllScalars = true]),
  tbl = #"Promoted Headers",
  swap = Table.ReplaceValue(
    tbl,
    each [City 1],
    each [City 2],
    (a, b, c) => if b > c then if a <= c then b else c else a,
    {"City 1", "City 2"}
  ),
  #"Grouped Rows" = Table.Group(
    swap,
    {"City 1", "City 2"},
    {{"Average Cost", each List.Average([Cost]), type number}}
  )
in
  #"Grouped Rows"
Power Query solution 12 for Avg Cost Between City Pairs, proposed by Thomas DUCROQUETZ:
let
  Source = YourRawData,
  ModifType = Table.TransformColumnTypes(
    Source,
    {{"City 1", type text}, {"City 2", type text}, {"Agency", type text}, {"Cost", type number}}
  ),
  CitiesCol = Table.AddColumn(
    ModifType,
    "Cities",
    each if [City 1] < [City 2] then [City 1] & ";" & [City 2] else [City 2] & ";" & [City 1]
  ),
  GroupByCities = Table.Sort(
    Table.Group(CitiesCol, {"Cities"}, {{"Average Cost", each List.Average([Cost]), type number}}),
    {"Average Cost", Order.Descending}
  ),
  SplitCities = Table.SplitColumn(
    GroupByCities,
    "Cities",
    Splitter.SplitTextByDelimiter(";", QuoteStyle.Csv),
    {"City 1", "City 2"}
  )
in
  SplitCities
Solving the challenge of Avg Cost Between City Pairs with Excel
Excel solution 1 for Avg Cost Between City Pairs, proposed by Bo Rydobon 🇹🇭:
=LET(a,
    A2:A11,
    b,
    B2:B11,
    c,
    D2:D11,
    u,
    IF(
        a
Excel solution 2 for Avg Cost Between City Pairs, proposed by Rick Rothstein:
=LET(
    c,
    BYROW(
        A2:B11,
        LAMBDA(
            r,
            TEXTJOIN(
                "-",
                ,
                SORT(
                    r,
                    ,
                    ,
                    1
                )
            )
        )
    ),
    u,
    UNIQUE(
        c
    ),
    SORT(
        HSTACK(
            u,
            MAP(
                u,
                LAMBDA(
                    x,
                    AVERAGE(
                        FILTER(
                            D2:D11,
                            c=x
                        )
                    )
                )
            )
        ),
        2,
        -1
    )
)
Excel solution 3 for Avg Cost Between City Pairs, proposed by John V.:
=LET(a,A2:A11,b,B2:B11,m,IF(a>b,b,a),n,IF(aExcel solution 4 for Avg Cost Between City Pairs, proposed by محمد حلمي:
=LET(
x,
    A2:B11,

v,
    DROP(
        REDUCE(
            0,
            SEQUENCE(
                ROWS(
                    x
                )
            ),
            LAMBDA(
                a,
                d,
                VSTACK(
                    a,
                    SORT(
                        INDEX(
                            x,
                            d,

                        ),
                        ,
                        ,
                        1
                    )
                )
            )
        ),
        1
    ),

u,
    UNIQUE(
        v
    ),

SORT(HSTACK(u,

MAP(TAKE(
    u,
    ,
    1
),
    DROP(
    u,
    ,
    1
),
    LAMBDA(q,
    w,
    AVERAGE(IF((q=TAKE(
        v,
        ,
        1
    ))*(w=DROP(
        v,
        ,
        1
    )),
    D2:D11))))),
    3,
    -1))
Excel solution 5 for Avg Cost Between City Pairs, proposed by محمد حلمي:
=LET(
x,A2:B11,
z,TOCOL(x),
v,WRAPROWS(SORTBY(z,ROUNDDOWN(SEQUENCE(ROWS(x)*2,,,1/2),),,z,),2),
u,UNIQUE(v),
SORT(HSTACK(u,MAP(TAKE(u,,1),DROP(u,,1),
LAMBDA(q,w,AVERAGE(IF((q=TAKE(v,,1))*(w=DROP(v,,1)),D2:D11))))),3,-1))
Excel solution 6 for Avg Cost Between City Pairs, proposed by 🇰🇷 Taeyong Shin:
=LET(

     Sorted,
     BYROW(
         A2:B11,
          LAMBDA(
              br,
               ARRAYTOTEXT(
                   SORT(
                       br,
                        ,
                        ,
                        1
                   )
               )
          )
     ),

     Ucity,
     UNIQUE(
         Sorted
     ),

     AvgCost,
     MAP(
         Ucity,
          LAMBDA(
              m,
               AVERAGE(
                   FILTER(
                       D2:D11,
                        Sorted = m
                   )
               )
          )
     ),


     SORT(
         HSTACK(
             TEXTSPLIT(
                 TEXTJOIN(
                     ";",
                      ,
                      Ucity
                 ),
                  ", ",
                  ";"
             ),
              AvgCost
         ),
          3,
          -1
     )

)

(2).
=LET(

     Sorted,
     IF(
         A2:A11 > B2:B11,
          HSTACK(
              B2:B11,
               A2:A11
          ),
          HSTACK(
              A2:A11,
               B2:B11
          )
     ),

     Ucity,
     UNIQUE(
         Sorted
     ),

     AvgCost,
     MAP(
          SEQUENCE(
              ROWS(
                  Ucity
              )
          ),

          LAMBDA(
              m,
               AVERAGE(
                   FILTER(
                       D2:D11,
                        MMULT(
                            N(
                                INDEX(
                                    Ucity,
                                     m,
                                     0
                                ) = Sorted
                            ),
                             {1;1}
                        )
                   )
               )
          )

     ),


     SORT(
         HSTACK(
             Ucity,
              AvgCost
         ),
          3,
          -1
     )

)
Excel solution 7 for Avg Cost Between City Pairs, proposed by 🇰🇷 Taeyong Shin:
=ROUNDDOWN(SEQUENCE(ROWS(x)*2,,,1/2),)
Also available as BITRSHIFT(SEQUENCE(ROWS(x)*2)+1, 1)&Excel solution 8 for Avg Cost Between City Pairs, proposed by 🇰🇷 Taeyong Shin:
=LET(a,A2:A11,b,B2:B11,GROUPBY(IF(a>b,HSTACK(b,a),A2:B11),D2:D11,AVERAGE,,0,-3))Excel solution 9 for Avg Cost Between City Pairs, proposed by Kris Jaganah:
=LET(
    a,
    A2:A11,
    b,
    B2:B11,
    c,
    IF(
        CODE(
            LEFT(
                a
            )
        )
Excel solution 10 for Avg Cost Between City Pairs, proposed by Julian Poeltl:
=LET(
    C,
    D2:D11,
    B,
    BYROW(
        A2:B11,
        LAMBDA(
            A,
            TEXTJOIN(
                ",",
                ,
                SORT(
                    A,
                    ,
                    ,
                    1
                )
            )
        )
    ),
    U,
    UNIQUE(
        B
    ),
    S,
    SORT(
        WRAPROWS(
            TEXTSPLIT(
                TEXTJOIN(
                    ",",
                    ,
                    U&","&MAP(
                        U,
                        LAMBDA(
                            A,
                            AVERAGE(
                                FILTER(
                                    C,
                                    B=A
                                )
                            )
                        )
                    )
                ),
                ","
            ),
            3
        ),
        3,
        -1
    ),
    IFERROR(
        S*1,
        S
    )
)
Excel solution 11 for Avg Cost Between City Pairs, proposed by Aditya Kumar Darak 🇮🇳:
=LET(
 _d, A2:D11,
 _ci, TAKE(_d, , 2),
 _e1, LAMBDA(a, b, VSTACK(a, SORT(CHOOSEROWS(_ci, b), , , 1))),
 _cis, DROP(REDUCE("", SEQUENCE(ROWS(_ci)), _e1), 1),
 _uci, UNIQUE(_cis),
 _e2, LAMBDA(a, b,
 AVERAGE(
 FILTER(
 TAKE(_d, , -1),
 (TAKE(_cis, , 1) = a) * (TAKE(_cis, , -1) = b)
 )
 )
 ),
 _a, MAP(TAKE(_uci, , 1), TAKE(_uci, , -1), _e2),
 _r, SORT(HSTACK(_uci, _a), 3, -1),
 _r
)
)
Excel solution 12 for Avg Cost Between City Pairs, proposed by Timothée BLIOT:
=LET(A,A2:B11,B,D2:D11,
O,BYROW(A,LAMBDA(a,TEXTJOIN("-",1,SORT(TRANSPOSE(a))))),
Av,BYROW(O,LAMBDA(a,SUMPRODUCT(B*(O=a))/SUMPRODUCT(1*(O=a)))),
SORT(UNIQUE(HSTACK(TEXTSPLIT(TEXTJOIN("/",1,O),"-","/"),Av)),3,-1))
Excel solution 13 for Avg Cost Between City Pairs, proposed by Charles Roldan:
=LET(City1,
    A2:A11,
    City2,
    B2:B11,
    Cost,
    D2:D11,

Pairs,
    UNIQUE(INDEX(HSTACK(
        City1,
        City2,
        City1
    ),

SEQUENCE(
    ROWS(
        Cost
    )
),
    {1,
    2}+(City1>City2))),

SORT(
    HSTACK(
        Pairs,
        BYROW(
            Pairs,
            LAMBDA(
                x,
                AVERAGE(
                    FILTER(
                        Cost,

                        0=MMULT(
                            --ISNA(
                                XMATCH(
                                    HSTACK(
                                        City1,
                                        City2
                                    ),
                                    x
                                )
                            ),
                            {1;1}
                        )
                    )
                )
            )
        )
    ),
    3,
    -1
))
Excel solution 14 for Avg Cost Between City Pairs, proposed by Stefan Olsson:
=BYROW(

     QUERY(

          ArrayFormula(
              {IF(
                  A1:A11>B1:B11,
                   {B1:B11&"-"&A1:A11},
                   {A1:A11&"-"&B1:B11}
              ),
               D1:D11}
          ),

          "Select Col1, AVG(Col2) Group By Col1 Order By AVG(Col2) Desc ",

          1
     ),

     LAMBDA(
         rr,

          {SPLIT(
              INDEX(
                  rr,
                  ,
                  1
              ),
              "-"
          ),
          INDEX(
              rr,
              1,
              2
          )}

     )

)
Excel solution 15 for Avg Cost Between City Pairs, proposed by Victor Momoh (MVP, MOS, R.Eng):
=LET(y,A2:B11,
a,MAKEARRAY(ROWS(y),2,LAMBDA(r,c,INDEX(SORT(INDEX(y,r,0),,,1),1,c))),
b,UNIQUE(a),
c,MAP(TAKE(b,,1),TAKE(b,,-1),LAMBDA(d,e,AVERAGE(FILTER(D2:D11,(TAKE(a,,1)=d)*(T
AKE(a,,-1)=e))))),
SORT(HSTACK(b,c),3,-1))
Excel solution 16 for Avg Cost Between City Pairs, proposed by Paolo Pozzoli:
Any hint about it Aditya Kumar Darak,
     Excel BI,
     Bhavya Gupta?
Excel solution 17 for Avg Cost Between City Pairs, proposed by Agah Dikici:
=LET(a,A2:A11,b,B2:B11,d,D2:D11,c,(LEFT(a)>LEFT(b)),e,IF(c,b&"-"&a&"*",a&"-"&b&"*"),f,UNIQUE(e),g,DROP(TEXTSPLIT(TEXTJOIN(,,f),"-","*"),-1),HSTACK(g,BYROW(f,LAMBDA(x,AVERAGE(FILTER(d,x=e))))))Solving the challenge of Avg Cost Between City Pairs with Python
Solving the challenge of Avg Cost Between City Pairs with Python in Excel
Python in Excel solution 1 for Avg Cost Between City Pairs, proposed by Alejandro Campos:
df = xl("A1:D11", headers=True)
df['City Pair'] = df.apply(lambda row: tuple(sorted([row['City 1'], row['City 2']])), axis=1)
average_costs = df.groupby('City Pair')['Cost'].mean().reset_index()
average_costs[['City1', 'City2']] = pd.DataFrame(average_costs['City Pair'].tolist(), index=average_costs.index)
average_costs = average_costs.drop(columns=['City Pair'])
average_costs = average_costs.rename(columns={'Cost': 'Average Cost'})
sorted_average_costs = average_costs.sort_values(by='Average Cost', ascending=False).reset_index(drop=True)
sorted_average_costs = sorted_average_costs.reindex(['City1', 'City2', 'Average Cost'], axis=1)
sorted_average_costs
Solving the challenge of Avg Cost Between City Pairs with DAX
DAX solution 1 for Avg Cost Between City Pairs, proposed by Zoran Milokanović:
EVALUATE
GROUPBY(
 SELECTCOLUMNS(
 Input,
 "City1", IF(Input[City 1] < Input[City 2], Input[City 1], Input[City 2]),
 "City2", IF(Input[City 1] < Input[City 2], Input[City 2], Input[City 1]),
 Input[Cost]
 ),
 [City1], [City2],
 "Average Cost", AVERAGEX(CURRENTGROUP(), Input[Cost])
)
ORDER BY
 [Average Cost] DESC
Solving the challenge of Avg Cost Between City Pairs with SQL
SQL solution 1 for Avg Cost Between City Pairs, proposed by Zoran Milokanović:
SELECT
 LEAST(D.CITY_1, D.CITY_2) AS CITY1
,GREATEST(D.CITY_1, D.CITY_2) AS CITY2
,AVG(D.COST) AS AVERAGE_COST
FROM DATA D
GROUP BY
 LEAST(D.CITY_1, D.CITY_2)
,GREATEST(D.CITY_1, D.CITY_2)
ORDER BY
 3 DESC, 1, 2
;