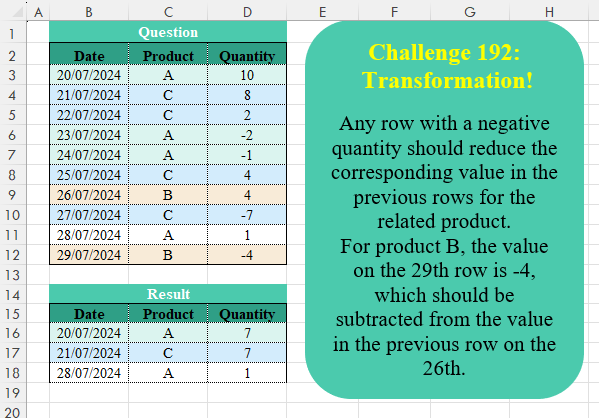
Any row with a negative quantity should reduce the corresponding value in the previous rows for the related product. For product B, the value on the 29th row is -4, which should be subtracted from the value in the previous row on the 26th.
📌 Challenge Details and Links
Challenge Number: 192
Challenge Difficulty: ⭐⭐⭐⭐
📥Download Sample File
📥Link to the solutions on LinkedIn
Solving the challenge of Table Transformation! Part 24 with Power Query
Power Query solution 1 for Table Transformation! Part 24, proposed by Luan Rodrigues:
let
  Fonte = Table.Group(
    Tabela1,
    {"Product"},
    {
      {
        "tab",
        each
          let
            b = Table.AddColumn(_, "res", each if [Quantity] < 1 then "neg" else null),
            c = Table.FillUp(b, {"res"}),
            d = Table.FromRows(
              Table.Group(
                c,
                "res",
                {"Quantity", each {_[Product]{0}} & {_[Date]{0}} & {List.Sum(_[Quantity])}}
              )[Quantity],
              {"Product", "Date", "Quantity"}
            )
          in
            d
      }
    }
  )[tab],
  exp = Table.Combine(Fonte),
  fil = Table.SelectRows(exp, each ([Quantity] <> 0)),
  res = Table.Sort(fil, {"Date", 0})[[Date], [Product], [Quantity]]
in
  res
Power Query solution 2 for Table Transformation! Part 24, proposed by Kris Jaganah:
let
  A = Excel.CurrentWorkbook(){[Name = "Table1"]}[Content],
  Z = Table.Combine(
    List.Transform(
      List.Distinct(A[Product]),
      (v) =>
        [
          B = Table.SelectRows(A, each ([Product] = v)),
          C = Table.AddIndexColumn(B, "Id", - 1),
          D = Table.AddColumn(
            C,
            "Ans",
            each Number.From([Quantity] > 0) * Number.From((try C[Quantity]{[Id]} otherwise 0) < 0)
          ),
          E = Table.AddColumn(D, "Acc", each List.Sum(List.FirstN(D[Ans], [Id] + 2))),
          F = Table.Group(
            E,
            "Acc",
            {
              {"Date", each [Date]{0}},
              {"Product", each [Product]{0}},
              {"Quantity", each List.Sum([Quantity])}
            }
          ),
          G = Table.SelectRows(F, each ([Quantity] > 0)),
          H = Table.RemoveColumns(G, {"Acc"})
        ][H]
    )
  ),
  W = Table.Sort(Z, "Date")
in
  W
Power Query solution 3 for Table Transformation! Part 24, proposed by Seokho MOON:
let
  Source = Excel.CurrentWorkbook(){[Name = "Table1"]}[Content],
  Group = Table.Group(Source, "Product", {"Tbl", Fun})[Tbl],
  Fun = each [
    A = Table.ToRows(_),
    B = List.Accumulate(List.Skip(A), {{A{0}{0}, A{0}{2}, A{0}{2} < 0}}, C),
    C = (a, v) =>
      if v{2} > 0 and List.Last(a){2} then
        a & {{v{0}, v{2}, v{2} < 0}}
      else
        List.RemoveLastN(a) & {{List.Last(a){0}, List.Last(a){1} + v{2}, v{2} < 0}},
    D = Table.FromList(B, (x) => {x{0}, [Product]{0}, x{1}}, Value.Type(_))
  ][D],
  Res = Table.SelectRows(Table.Sort(Table.Combine(Group), "Date"), each [Quantity] > 0)
in
  Res
Power Query solution 4 for Table Transformation! Part 24, proposed by Aleksandr Mynka:
let
  src = Excel.CurrentWorkbook(){[Name = "SourceTable"]}[Content],
  recs = Table.ToRecords(src),
  acc = List.Accumulate(
    List.Reverse(recs),
    [],
    (s, c) =>
      if Record.HasFields(s, c[Product]) then
        s
      else if c[Quantity] > 0 then
        Record.AddField(s, c[Product], c)
      else
        Record.AddField(s, c[Product], [])
  ),
  excl = List.Select(Record.ToList(acc), (r) => Record.FieldCount(r) > 0),
  rem = Table.RemoveMatchingRows(src, excl),
  gr = Table.Group(
    rem,
    {"Product"},
    {{"Date", each List.Min([Date])}, {"Quantity", each List.Sum([Quantity])}}
  ),
  add = Table.InsertRows(gr, 0, excl),
  fltr = Table.SelectRows(Table.Sort(add, {"Date"}), each [Quantity] <> 0),
  res = Table.ReorderColumns(fltr, {"Date", "Product", "Quantity"})
in
  res
Power Query solution 5 for Table Transformation! Part 24, proposed by Sahan Jayasuriya:
let
  Source = Excel.CurrentWorkbook(){[Name = "Data"]}[Content],
  SortbyPandD = Table.Sort(Source, {{"Product", Order.Ascending}, {"Date", Order.Ascending}}),
  AddIndex = Table.AddIndexColumn(SortbyPandD, "Index", 0, 1, Int64.Type),
  GroupBy = Table.Group(
    AddIndex,
    Table.ColumnNames(AddIndex),
    {{"Final Qty", each List.Sum(_[Quantity]), Int64.Type}},
    GroupKind.Global,
    (x, y) =>
      [
        currval = AddIndex{if y[Index] = 0 then y[Index] else y[Index] - 1}[Quantity],
        nextval = y[Quantity],
        a = Number.From(
          if ((currval > 0) and (nextval < 0)) then
            false
          else if ((currval > 0) and (nextval > 0)) then
            false
          else if ((currval < 0) and (nextval < 0)) then
            false
          else
            true
        ),
        b = Comparer.OrdinalIgnoreCase(x[Product], y[Product]),
        c = if b = 0 then a else b
      ][c]
  ),
  QtyGreaterThanZero = Table.SelectRows(GroupBy, each [Final Qty] > 0),
  SortByDate = Table.Sort(QtyGreaterThanZero, {{"Date", Order.Ascending}})[
    [Date],
    [Product],
    [Final Qty]
  ]
in
  SortByDate
Power Query solution 6 for Table Transformation! Part 24, proposed by Vida Vaitkunaite:
let
 Source = Excel.CurrentWorkbook(){[Name="Table1"]}[Content],
 Group = Table.Group(Source, {"Product"}, {{"All", each let
a = _,
b = List.Last(a[Quantity]),
c = List.Count(a[Date])-1,
d = Table.Split(a, c),
e = if b < 0 then {a} else d
in e}}),
 Custom = Table.AddColumn(Group, "Custom", each Table.Combine(List.Transform([All],
 (x)=> Table.FromColumns({{List.Min(x[Date])}, {List.First(x[Product])}, {List.Sum(x[Quantity])}}, Table.ColumnNames(Source))))),
 Combine = Table.SelectRows(Table.Combine(Custom[Custom]), each ([Quantity] <> 0)),
 Sort = Table.Sort(Combine,{{"Date", 0}})
in
 Sort
Solving the challenge of Table Transformation! Part 24 with Excel
Excel solution 1 for Table Transformation! Part 24, proposed by Oscar Mendez Roca Farell:
=LET(m,
    MAP(C3:C12,
    D3:D12,
    LAMBDA(c,
    d,
    LET(x,
    XLOOKUP(1,
    1/(d:D12<0)/(c:C12=c),
    d:D12,
    d,
    ,
    -1),
    SUM((TAKE(
        c:x,
        ,
        1
    )=c)*d:x)))),
    FILTER(
        HSTACK(
            B3:C12,
            m
        ),
        m>0
    ))
Excel solution 2 for Table Transformation! Part 24, proposed by Kris Jaganah:
=LET(p,
    C3:C12,
    q,
    DROP(REDUCE(0,
    UNIQUE(
        p
    ),
    LAMBDA(x,
    y,
    VSTACK(x,
    LET(a,
    FILTER(
        B3:D12,
        p=y
    ),
    b,
    TAKE(
        a,
        ,
        -1
    ),
    c,
    VSTACK(
        0,
        DROP(
            b,
            -1
        )
    ),
    d,
    SCAN(,
    (b>0)*(c<0),
    SUM),
    DROP(
        GROUPBY(
            d,
            HSTACK(
                DROP(
        a,
        ,
        -1
    ),
                b
            ),
            HSTACK(
                SINGLE,
                SINGLE,
                SUM
            ),
            ,
            0
        ),
        1,
        1
    ))))),
    1),
    VSTACK(
        B2:D2,
        SORT(
            FILTER(
                q,
                TAKE(
                    q,
                    ,
                    -1
                )>0
            )
        )
    ))
Excel solution 3 for Table Transformation! Part 24, proposed by Md. Zohurul Islam:
=LET(
    dt,
    B3:B12,
    prd,
    C3:C12,
    qty,
    D3:D12,
    hdr,
    B2:D2,
    f,
    LAMBDA(
        w,
        LET(
            a,
            ABS(
                w<0
            ),
            b,
            ABS(
                DROP(
                    a,
                    -1
                )<>DROP(
                    a,
                    1
                )
            ),
            c,
            IFNA(
                a*b,
                1
            ),
            d,
            SCAN(
                0,
                c,
                SUM
            ),
            e,
            IF(
                d=0,
                1,
                d
            ),
            e
        )
    ),
    j,
    DROP(
        REDUCE(
            "",
            UNIQUE(
                prd
            ),
            LAMBDA(
                x,
                y,
                LET(
                    p,
                    FILTER(
                        dt,
                        prd=y
                    ),
                    q,
                    FILTER(
                        qty,
                        prd=y
                    ),
                    r,
                    f(
                        q
                    ),
                    s,
                    DROP(
                        GROUPBY(
                            r,
                            q,
                            SUM,
                            0,
                            0
                        ),
                        ,
                        1
                    ),
                    t,
                    DROP(
                        GROUPBY(
                            r,
                            p,
                            MIN,
                            0,
                            0
                        ),
                        ,
                        1
                    ),
                    u,
                    IFNA(
                        HSTACK(
                            t,
                            y,
                            s
                        ),
                        y
                    ),
                    v,
                    VSTACK(
                        x,
                        u
                    ),
                    v
                )
            )
        ),
        1
    ),
    k,
    SORT(
        FILTER(
            j,
            TAKE(
                j,
                ,
                -1
            )>0
        ),
        1,
        1
    ),
    m,
    VSTACK(
        hdr,
        k
    ),
    m
)
Excel solution 4 for Table Transformation! Part 24, proposed by Pieter de B.:
=LET(b,
    B3:B12,
    c,
    C3:C12,
    d,
    D3:D12,
    m,
    MAP(
        d,
        LAMBDA(
            e,
            AND(
                e>0,
                IFERROR(
                    TAKE(
                        DROP(
                            FILTER(
                                D3:e,
                                TAKE(
                                    C3:e,
                                    ,
                                    1
                                )=TAKE(
                                    C3:e,
                                    -1,
                                    1
                                )
                            ),
                            -1
                        ),
                        -1
                    ),
                    -1
                )<0
            )
        )
    ),
    L,
    LAMBDA(
        x,
        FILTER(
            x,
            m
        )
    ),
    h,
    SUMIFS(d,
    c,
    L(
        c
    ),
    b,
    ">="&L(
        b
    ),
    b,
    "<"&MAP(L(
        b
    ),
    L(
        c
    ),
    LAMBDA(x,
    y,
     XLOOKUP(1,
    (L(
        b
    )>x)*(L(
        c
    )=y),
    L(
        b
    ),
    99999)))),
    FILTER(
        HSTACK(
            L(
        b
    ),
            L(
        c
    ),
            h
        ),
        h
    ))
Solving the challenge of Table Transformation! Part 24 with Python
Python solution 1 for Table Transformation! Part 24, proposed by Konrad Gryczan, PhD:
import pandas as pd
import numpy as np

path = "CH-192 Table Transformation.xlsx"
input = pd.read_excel(path, usecols="B:D", skiprows=1, nrows=11)
test = pd.read_excel(path, usecols="B:D", skiprows=14, nrows=4)

input['sign'] = np.sign(input['Quantity'])
input['group'] = input.groupby('Product')['sign'].apply(lambda x: (x != x.shift()).cumsum()).reset_index(level=0, drop=True)
input['group'] = np.ceil(input['group']/2)
result = input.groupby(['Product', 'group']).agg({'Quantity': 'sum', 'Date': 'min'}).reset_index()
result = result[result['Quantity'] != 0][['Date', 'Product', 'Quantity']].sort_values(by = "Date").reset_index(drop= True)

print(result.equals(test)) # True
Python solution 2 for Table Transformation! Part 24, proposed by Luan Rodrigues:
import pandas as pd
import numpy as np
file = "CH-192 Table Transformation.xlsx"
df = pd.read_excel(file, usecols="B:D",skiprows=1, nrows=10)
def trasnform(x):
 x['res'] = np.where(x['Quantity'] < 1, "neg", pd.NA)
 x['res'] = x['res'].bfill()
 x['res'] = np.where(pd.isna(x['res']),'pos',x['res'])
 x = x.groupby('res', as_index=False).agg({
 'Quantity': 'sum',
 'Date': 'first'
 })
 return x
df = df.groupby('Product').apply(trasnform).reset_index()[['Date','Product','Quantity']]
df = df[df['Quantity'] != 0].sort_values(by='Date')
print(df)
Solving the challenge of Table Transformation! Part 24 with Python in Excel
Python in Excel solution 1 for Table Transformation! Part 24, proposed by Alejandro Campos:
df = xl("B2:D12", headers=True)
def adjust_quantities(df):
 for product in df['Product'].unique():
 idx = df[df['Product'] == product].index
 for i in range(len(idx)-1, 0, -1):
 if df.at[idx[i], 'Quantity'] < 0:
 df.at[idx[i-1], 'Quantity'] += df.at[idx[i], 'Quantity']
 df.at[idx[i], 'Quantity'] = 0
 return df[df['Quantity'] != 0].reset_index(drop=True)
adjusted_df = adjust_quantities(df)
Solving the challenge of Table Transformation! Part 24 with R
R solution 1 for Table Transformation! Part 24, proposed by Konrad Gryczan, PhD:
library(tidyverse)
library(readxl)

path = "files/CH-192 Table Transformation.xlsx"
input = read_excel(path, range = "B2:D12")
test = read_excel(path, range = "B15:D18")

result = input %>%
 mutate(sign = sign(Quantity)) %>%
 mutate(group = ceiling(cumsum(sign != lag(sign, default = 0))/2), .by = Product) %>%
 summarise(Quantity = sum(Quantity),
 Date = min(Date),
 .by = c(Product,group)) %>%
 filter(Quantity != 0) %>%
 select(Date, Product, Quantity)

all.equal(result, test)
#> [1] TRUE
Solving the challenge of Table Transformation! Part 24 with Google Sheets
Google Sheets solution 1 for Table Transformation! Part 24, proposed by Peter Krkos:
PowerQuery solution:
https://docs.google.com/spreadsheets/d/1zR5IZLz8OT76vhaPEHfsPrw8-RDKnLyyqS49IJjdhFk/edit?pli=1&gid=290930902#gid=290930902