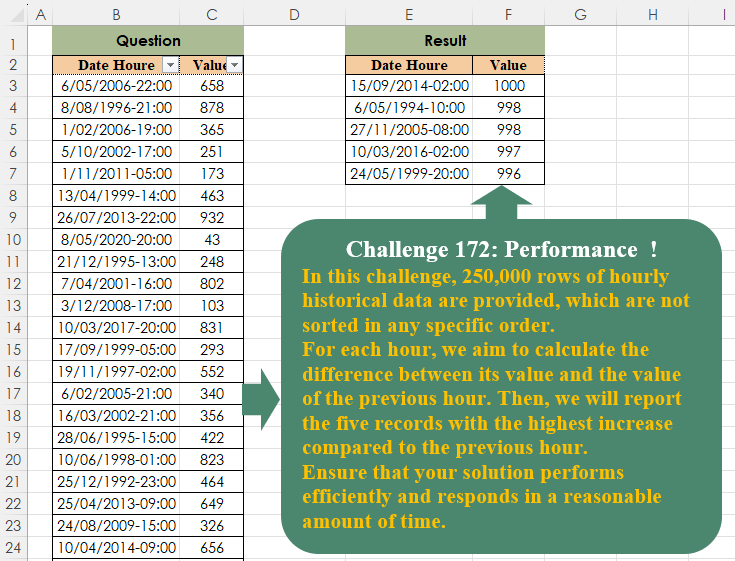
In this challenge, 250,000 rows of hourly historical data are provided, which are not sorted in any specific order.For each hour, we aim to calculate the difference between its value and the value of the previous hour. Then, we will report the five records with the highest increase compared to the previous hour. Ensure that your solution performs efficiently and responds in a reasonable amount of time.
📌 Challenge Details and Links
Challenge Number: 172
Challenge Difficulty: ⭐⭐⭐
📥Download Sample File
📥Link to the solutions on LinkedIn
Solving the challenge of Performance! with Power Query
Power Query solution 1 for Performance!, proposed by Alejandro Simón 🇵🇦 🇪🇸:
let
Source = Excel.CurrentWorkbook(){[Name="Table1"]}[Content],
Order = Table.Sort(Source,{{"Date Houre", 0}}),
Diff =
 let
 a = Order[Value],
 b = {0}&List.RemoveLastN(a),
 c = List.Zip({b,a}),
 d = List.Transform(c, each _{1}-_{0})
 in d,
Tbl = Table.FirstN(Table.Sort(Table.FromColumns(Table.ToColumns(Order)&{Diff},
 Table.ColumnNames(Order)&{"Col"}), {"Col",1}),5),
Sol = Table.Sort(Table.SelectColumns(Tbl, Table.ColumnNames(Order)), {"Value", 1})
in
Sol
Power Query solution 2 for Performance!, proposed by Kris Jaganah:
let
  A = Excel.CurrentWorkbook(){[Name = "Table1"]}[Content],
  B = Table.Sort(A, "Date Houre"),
  C = Table.AddColumn(B, "Less 1", each DateTime.From(Number.From([Date Houre]) - (1 / 24))),
  D = Table.NestedJoin(C, {"Date Houre"}, C, {"Less 1"}, "Com", JoinKind.LeftOuter),
  E = Table.ExpandTableColumn(D, "Com", {"Value"}, {"Val1"}),
  F = Table.AddColumn(E, "Custom", each [Val1] - [Value]),
  G = Table.MaxN(F, "Custom", 5),
  H = Table.Sort(G, {"Val1", 1})[[Date Houre], [Val1]]
in
  H
Power Query solution 3 for Performance!, proposed by Glyn Willis:
let
  Source = Excel.CurrentWorkbook(){[Name = "Table1"]}[Content],
  CType = Table.TransformColumnTypes(Source, {{"Date Houre", type datetime}, {"Value", Int64.Type}}),
  Time = Table.AddColumn(CType, "Time", each DateTime.Time([Date Houre]), type time),
  CType1 = Table.TransformColumnTypes(Time, {{"Date Houre", type date}}),
  Custom = Table.AddColumn(
    CType1,
    "Custom",
    each [ID = (Number.From([Date Houre]) * 24) + (Number.From([Time]) * 24), PrvID = ID - 1],
    type record
  ),
  Expand = Table.ExpandRecordColumn(Custom, "Custom", {"ID", "PrvID"}, {"ID", "PrvID"}),
  CType2 = Table.AddKey(
    Table.TransformColumnTypes(Expand, {{"ID", type text}, {"PrvID", type text}}),
    {"Date Houre", "Time"},
    true
  ),
  Custom1 =
    let
      Tbl1 = Table.RenameColumns(CType2[[ID], [Value]], {"Value", "PrvValue"}),
      Tbl2 = CType2[[Date Houre], [Time], [PrvID], [Value]]
    in
      Table.Join(Tbl2, "PrvID", Tbl1, "ID"),
  Subtraction = Table.AddColumn(Custom1, "Subtraction", each [Value] - [PrvValue], Int64.Type),
  Custom2 = Table.MaxN(Subtraction, "Subtraction", 5),
  Sorted = Table.Sort(Custom2, {{"Value", Order.Descending}})[
    [Date Houre],
    [Time],
    [Value],
    [Subtraction]
  ]
in
  Sorted
Power Query solution 4 for Performance!, proposed by Vida Vaitkunaite:
let
  Source = Excel.CurrentWorkbook(){[Name = "Table1"]}[Content],
  Earlier = Table.AddColumn(Source, "Earlier", each [Date Houre] - #duration(0, 1, 0, 0)),
  Merge = Table.NestedJoin(
    Earlier,
    {"Earlier"},
    Earlier,
    {"Date Houre"},
    "Added Custom1",
    JoinKind.LeftOuter
  ),
  Expand = Table.ExpandTableColumn(Merge, "Added Custom1", {"Value"}, {"Value2"}),
  Diff = Table.AddColumn(Expand, "Diff", each [Value] - [Value2]),
  Final = Table.Sort(
    Table.SelectColumns(Table.MaxN(Diff, "Diff", 5), {"Date Houre", "Value"}),
    {{"Value", Order.Descending}}
  )
in
  Final
Solving the challenge of Performance! with Excel
Excel solution 1 for Performance!, proposed by Bo Rydobon 🇹🇭:
=LET(
    z,
    SORT(
        Table1
    ),
    d,
    DROP(
        z,
        1
    ),
    SORT(
        TAKE(
            SORT(
                HSTACK(
                    d,
                    d-DROP(
                        z,
                        -1
                    )
                ),
                4,
                -1
            ),
            5,
            2
        ),
        2,
        -1
    )
)
Excel solution 2 for Performance!, proposed by Oscar Mendez Roca Farell:
=LET(
    d,
    B3:B250000,
    v,
    C3:C250000,
    SORT(
        TAKE(
            SORT(
                HSTACK(
                    Table1,
                    XLOOKUP(
                        --TEXT(
                            d-1/24,
                            "dd/mm/e hh:mm"
                        ),
                        d,
                        v,
                        v
                    )-v
                ),
                3
            ),
            5,
            2
        ),
        2,
        -1
    )
)
Excel solution 3 for Performance!, proposed by Julian Poeltl:
=LET(
    T,
    Table1,
    S,
    SORT(
        T
    ),
    V,
    DROP(
        S,
        ,
        1
    ),
    D,
    VSTACK(
        0,
        DROP(
            V-DROP(
                V,
                1
            ),
            -1
        )
    )*-1,
    SORT(
        FILTER(
            S,
            D>LARGE(
                D,
                6
            )
        ),
        2,
        -1
    )
)
Excel solution 4 for Performance!, proposed by Kris Jaganah:
=LET(
    a,
    SORT(
        Table1,
        1,
        -1
    ),
    b,
    IFNA(
        DROP(
            a,
            ,
            1
        )-DROP(
            a,
            1,
            1
        ),
        0
    ),
    DROP(
        SORT(
            TAKE(
                SORT(
                    HSTACK(
                        a,
                        b
                    ),
                    {3,
                    2},
                    {-1,
                    -1}
                ),
                5
            ),
            2,
            -1
        ),
        ,
        -1
    )
)
Excel solution 5 for Performance!, proposed by Sunny Baggu:
=LET(     _a,
     SORT(
         Table1
     ),     _b,
     DROP(
         _a,
          1
     ) - DROP(
         _a,
          -1
     ),     _c,
     SORTBY(
         DROP(
         _a,
          1
     ),
          TAKE(
              _b,
               ,
               -1
          ),
          -1
     ),     SORT(
         TAKE(
             _c,
              5
         ),
          2,
          -1
     ))
Excel solution 6 for Performance!, proposed by Hamidi Hamid:
=LET(
    x,
    SORT(
        B3:C250000,
        {1,
        2},
        {-1,
        -1}
    ),
    z,
    TAKE(
        x,
        ,
        -1
    )-VSTACK(
        DROP(
            TAKE(
        x,
        ,
        -1
    ),
            1
        ),
        0
    ),
    f,
    FILTER(
        x,
        z>LARGE(
            z,
            6
        )
    ),
    SORT(
        f,
        {2,
        1},
        {-1,
        1}
    )
)
Excel solution 7 for Performance!, proposed by Md. Zohurul Islam:
=LET(
    hdr,
    Table1[    #Headers],    data,
    Table1,    a,
    SORT(
        data,
        1,
        -1
    ),    b,
    DROP(
        a,
        ,
        1
    ),    c,
    VSTACK(
        DROP(
            b,
            1
        ),
        0
    ),    d,
    b-c,    e,
    SORT(
        HSTACK(
            a,
            d
        ),
        {3,
        2},
        {-1,
        -1}
    ),    f,
    TAKE(
        DROP(
            e,
            ,
            -1
        ),
        5
    ),    g,
    VSTACK(
        hdr,
        SORT(
            f,
            2,
            -1
        )
    ),    g
)
Excel solution 8 for Performance!, proposed by Nicolas Micot:
=LET(
    _data;
    Table1;
    _tri;
    TRIER(
        _data;
        1;
        1
    );
    _dates;
    CHOISIRCOLS(
        _tri;
        1
    );
    _valeurs;
    CHOISIRCOLS(
        _tri;
        2
    );
    _variation;
    ASSEMB.V(
        -10^9;
        EXCLURE(
            _valeurs;
            1
        )-EXCLURE(
            _valeurs;
            -1
        )
    );
    PRENDRE(
        TRIERPAR(
            _tri;
            _variation;
            -1
        );
        5
    )
)
Excel solution 9 for Performance!, proposed by Pieter de B.:
=LET(
    s,
    SORT,
    d,
    DROP,
    x,
    s(
        Table1
    ),
    s(
        TAKE(
            s(
                HSTACK(
                    x,
                    VSTACK(
                        0,
                        d(
                            x,
                            1,
                            1
                        )-d(
                            x,
                            -1,
                            1
                        )
                    )
                ),
                3,
                -1
            ),
            5,
            2
        ),
        2,
        -1
    )
)
Solving the challenge of Performance! with Python
Python solution 1 for Performance!, proposed by Konrad Gryczan, PhD:
import pandas as pd
import time

path = "CH-172 Performance  Optimization.xlsx"
input = pd.read_excel(path, usecols="B:C", skiprows=1, nrows=249999)
test = pd.read_excel(path, usecols="E:F", skiprows=1, nrows=5).rename(columns=lambda x: x.split('.')[0])

start_time = time.time()
input = input.sort_values(by="Date Houre").assign(Value_diff=lambda x: x['Value'] - x['Value'].shift(1))
result = input.nlargest(5, "Value_diff").sort_values(by="Value", ascending=False).reset_index(drop=True).drop(columns=["Value_diff"])
end_time = time.time()
print(f"Execution time: {end_time - start_time} seconds")
# Execution time: 0.0416 seconds

print(result.equals(test)) # True
Solving the challenge of Performance! with Python in Excel
Python in Excel solution 1 for Performance!, proposed by Aditya Kumar Darak 🇮🇳:
df = xl("Table1[
hashtag
#All]", True)

df = df.sort_values("Date Houre")

i = df["Value"].diff().nlargest(5).index

result = df.loc[i].sort_values("Value", ascending=False).reset_index(drop=True)

result
Python in Excel solution 2 for Performance!, proposed by Alejandro Campos:
df = (
 xl("Table1[
hashtag
#Todo]", headers=True)
 .assign(Date_Hour=lambda df: pd.to_datetime(df['Date_Hour'], format='%d/%m/%Y-%H:%M'))
 .sort_values('Date_Hour')
 .assign(Difference=lambda df: df['Value'].diff())
 .nlargest(5, 'Difference')
 .sort_values('Value', ascending=False)
 .drop(columns='Difference')
 .reset_index(drop=True))
Solving the challenge of Performance! with R
R solution 1 for Performance!, proposed by Konrad Gryczan, PhD:
library(tidyverse)
library(readxl)

path = "files/CH-172 Performance Optimization.xlsx"
input = read_excel(path, range = "R2C2:R250000C3")
# one place where readxl wasn't sure what i wanted :D And I needed to use Row-Col notation :D
test = read_excel(path, range = "E2:F7")

tictoc::tic()
result = input %>%
 arrange(`Date Houre`) %>%
 slice_max(Value - lag(Value), n = 5) %>%
 arrange(desc(Value))
tictoc::toc()
# 0.01 to 0.05 sec elapsed in few attempts.

all.equal(result, test)
# [1] TRUE
Solving the challenge of Performance! with Google Sheets
Google Sheets solution 1 for Performance!, proposed by Peter Krkos:
PoweQuery solution:
https://docs.google.com/spreadsheets/d/1zR5IZLz8OT76vhaPEHfsPrw8-RDKnLyyqS49IJjdhFk/edit?pli=1&gid=557543161#gid=557543161