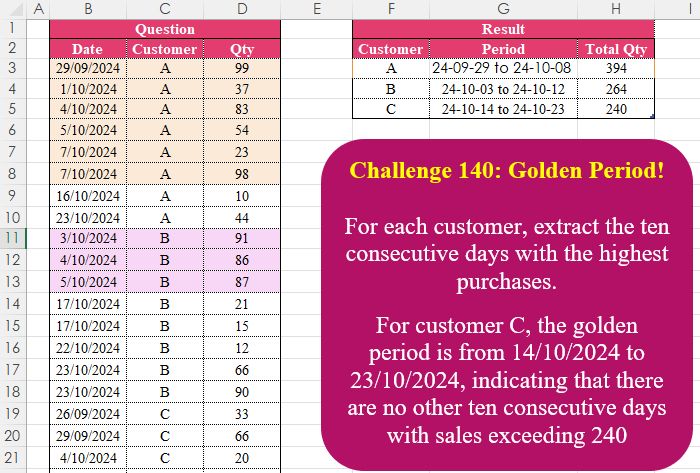
For each customer, extract the ten consecutive days with the highest purchases. For customer C, the golden period is from 14/10/2024 to 23/10/2024, indicating that there are no other ten consecutive days with sales exceeding 240
📌 Challenge Details and Links
Challenge Number: 140
Challenge Difficulty: ⭐⭐⭐⭐⭐
📥Download Sample File
📥Link to the solutions on LinkedIn
Solving the challenge of Golden Period! with Power Query
Power Query solution 1 for Golden Period!, proposed by Zoran Milokanović:
let
  Source = Excel.CurrentWorkbook(){[Name = "Input"]}[Content],
  S = Table.Combine(
    Table.Group(
      Source,
      "Customer",
      {
        "A",
        (g) =>
          Table.FromRows(
            {
              List.Last(
                List.Sort(
                  Table.TransformRows(
                    g,
                    each
                      let
                        f = [Date],
                        t = [Date] + Duration.From(9),
                        d = each DateTime.ToText(_, "yy-MM-dd")
                      in
                        {
                          g[Customer]{0},
                          d(f) & " to " & d(t),
                          List.Sum(Table.SelectRows(g, each [Date] >= f and [Date] <= t)[Qty])
                        }
                  ),
                  each _{2}
                )
              )
            },
            {"Customer", "Period", "Total Qty"}
          )
      }
    )[A]
  )
in
  S
Power Query solution 2 for Golden Period!, proposed by Aditya Kumar Darak 🇮🇳:
let
  Source = Excel.CurrentWorkbook(){[Name = "data"]}[Content],
  Group = Table.Group(
    Source,
    "Customer",
    {
      "R",
      each [
        T = Table.TransformRows(
          _,
          (f) =>
            f
              & [
                eDt = f[Date] + #duration(9, 0, 0, 0),
                s = Table.SelectRows(_, (x) => x[Date] >= f[Date] and x[Date] <= eDt),
                Qty = List.Sum(s[Qty]),
                Date = DateTime.ToText(f[Date], "yyy-MM-dd")
                  & " to "
                  & DateTime.ToText(eDt, "yyy-MM-dd")
              ]
        ),
        Mx = List.Max(T, null, (f) => f[Qty])
      ][Mx]
    }
  ),
  Return = Table.ExpandRecordColumn(Group, "R", {"Date", "Qty"})
in
  Return
Power Query solution 3 for Golden Period!, proposed by Alejandro Simón 🇵🇦 🇪🇸:
let
Source = Excel.CurrentWorkbook(){[Name="Table2"]}[Content],
Sol = Table.Combine(Table.Group(Source, {"Customer"}, {{"A", each
 let
 a = _,
 b = Table.Group(a, "Date", {"B", each List.Sum([Qty])},0,
 (x,y)=> Number.From(Number.From(y-x)>10)),
 c = Record.ToList(Table.Max(b, "B")),
 d = Date.ToText(Date.From(c{0}), "yy-MM-dd") &" to "&
 Date.ToText(Date.AddDays(Date.From(c{0}),9), "yy-MM-dd"),
 e = Table.FromColumns({{a[Customer]{0}},{d}, {c{1}}},
 {"Customer","Period", "Total Qty"})
 in e}})[A])
in
Sol
Power Query solution 4 for Golden Period!, proposed by Kris Jaganah:
let
  A = Excel.CurrentWorkbook(){[Name = "Table7"]}[Content],
  B = Table.TransformColumnTypes(A, {{"Date", Int64.Type}}),
  C = Table.Group(
    B,
    {"Customer"},
    {
      "All",
      each
        let
          a = Table.Group(_, {"Date"}, {"Qty", (r) => List.Sum(r[Qty])}),
          b = List.Min(a[Date]),
          c = {b .. List.Max(B[Date])},
          d = Table.FromList(
            c,
            each {
              _,
              List.Zip(List.Select(List.Zip({a[Date], a[Qty]}), (x) => x{0} = _)){1}?{0}? ?? 0,
              _ - b
            },
            {"Date", "Qty", "Id"}
          ),
          e = Table.AddColumn(
            d,
            "Rng",
            each List.Sum(List.LastN(List.FirstN(d[Qty], [Id] + 1), 10))
          ),
          f = e[Rng],
          g = List.Max(f),
          h = e[Date]{List.PositionOf(f, g, Occurrence.Last)},
          i = (m) => Date.ToText(Date.From(m), [Format = "yy-MM-dd"]),
          j = Text.Combine({i(h - 9), i(h)}, " to ")
        in
          {[Customer]{0}, j, g}
    }
  )[All],
  D = Table.FromRows(C, {"Customer", "Period", "Total Qty"})
in
  D
Power Query solution 5 for Golden Period!, proposed by 🇮🇷 Navid Esmaeilzadeh اسماعیل زاده:
let
S = Excel.CurrentWorkbook(){[Name="Table2"]}[Content],
A = Table.TransformColumnTypes(S,{{"Date", type date}}),
A2 = Table.Group(A, {"Date", "Customer"}, {{"Qty", each List.Sum([Qty]), type number}}),
B = Table.AddColumn(A2, "P", each List.Dates([Date],10,
hashtag
#duration(1,0,0,0))),
C = Table.AddColumn(B, "Period", each Text.From([Date])&" To "&Text.From(List.Last([P]))),
D = Table.SelectColumns(C,{"Customer", "Period", "P"}),
E = Table.ExpandListColumn(D, "P"),
F = Table.NestedJoin(E,{"Customer","P"},A2,{"Customer","Date"},"C"),
G = Table.ExpandTableColumn(F, "C", {"Qty"}, {"Qty"}),
H = Table.Group(G, {"Customer", "Period"}, {{"Total Qty", each List.Sum([Qty])}}),
I = Table.Group(H, {"Customer"}, {{"T", each _}}),
J = Table.AddColumn(I, "T2", each Table.First(Table.Sort([T],{"Total Qty",Order.Descending}))),
K = Table.SelectColumns(J,{"T2"}),
L = Table.ExpandRecordColumn(K, "T2", {"Customer", "Period", "Total Qty"}, {"Customer", "Period", "Total Qty"})
in
L
Power Query solution 6 for Golden Period!, proposed by Aleksandr Mynka:
let
  fx = (r) =>
    [
      start = r[Date],
      end = Date.AddDays(start, 9),
      sum = List.Sum(
        Table.SelectRows(
          src,
          each ([Customer] = r[Customer]) and ([Date] >= start and [Date] <= end)
        )[Qty]
      )
    ][[end], [sum]],
  gx = (r) =>
    [
      trans     = (d) => DateTime.ToText(d, "yy-MM-dd"),
      Period    = trans(r[Date]) & " to " & trans(r[end]),
      Total Qty = r[sum]
    ][[Period], [Total Qty]],
  src = Excel.CurrentWorkbook(){[Name = "Table1"]}[Content],
  tbl = Table.AddColumn(src, "total", fx),
  exp = Table.ExpandRecordColumn(tbl, "total", {"end", "sum"}),
  gr = Table.Group(
    exp,
    {"Customer"},
    {"Result", (tbl) => Table.Sort(tbl, {"sum", Order.Descending}){0}}
  ),
  tr = Table.TransformColumns(gr, {"Result", gx}),
  to = Table.ExpandRecordColumn(tr, "Result", {"Period", "Total Qty"})
in
  to
Power Query solution 7 for Golden Period!, proposed by Vida Vaitkunaite:
let
  Source = Excel.CurrentWorkbook(){[Name = "Table1"]}[Content],
  End = Table.AddColumn(Source, "End", each Date.From(Number.From([Date]) + 9)),
  No = Table.AddIndexColumn(End, "No", 1, 1),
  Dates = Table.AddColumn(No, "Dates", each {Number.From([Date]) .. Number.From([End])}),
  Exp = Table.ExpandListColumn(Dates, "Dates"),
  Types = Table.TransformColumnTypes(
    Exp,
    {{"Dates", type date}, {"End", type date}, {"Date", type date}}
  ),
  Merged = Table.NestedJoin(
    Types,
    {"Customer", "Dates"},
    Types,
    {"Customer", "Date"},
    "Tbl",
    JoinKind.LeftOuter
  ),
  Exp2 = Table.ExpandTableColumn(Merged, "Tbl", {"Qty"}, {"Qty.1"}),
  Distinct = Table.Distinct(Exp2, {"End", "Dates", "Qty.1"}),
  Gr = Table.Group(
    Distinct,
    {"Customer", "No"},
    {
      {"Dates", each Date.ToText(List.Min([Dates]), "yy-MM-dd"), type text},
      {"End", each Date.ToText(List.Max([End]), "yy-MM-dd"), type text},
      {"Total Qty", each List.Sum([Qty.1]), type number}
    }
  ),
  Gr2 = Table.Group(Gr, {"Customer"}, {{"All", each Table.MaxN(_, "Total Qty", 1), type table}}),
  Exp3 = Table.ExpandTableColumn(
    Gr2,
    "All",
    {"Dates", "End", "Total Qty"},
    {"Dates", "End", "Total Qty"}
  ),
  Final = Table.CombineColumns(
    Exp3,
    {"Dates", "End"},
    Combiner.CombineTextByDelimiter(" to "),
    "Period"
  )
in
  Final
Solving the challenge of Golden Period! with Excel
Excel solution 1 for Golden Period!, proposed by Bo Rydobon 🇹🇭:
=LET(
    d,
    B3:B26,
    c,
    C3:C26,
    e,
    d+9,
    g,
    SORT(
        HSTACK(
            c,
            TEXT(
                d,
                "y-mm-dd"
            )&" to "&TEXT(
                e,
                "y-mm-dd"
            ),
            SUMIFS(
                D3:D26,
                c,
                c,
                d,
                ">="&d,
                d,
                "<="&e
            )
        ),
        3,
        -1
    ),    GROUPBY(
        TAKE(
            g,
            ,
            1
        ),
        DROP(
            g,
            ,
            1
        ),
        SINGLE,
        ,
        0
    )
)
Excel solution 2 for Golden Period!, proposed by Aditya Kumar Darak 🇮🇳:
=LET(     _dts,
     B3:B26,     _cust,
     C3:C26,     _qty,
     D3:D26,     _eDts,
     _dts + 9,     _frmt,
     "yyy-mm-dd",     _tqty,
     SUMIFS(
         _qty,
          _cust,
          _cust,
          _dts,
          ">=" & _dts,
          _dts,
          "<=" & _eDts
     ),     _rngDts,
     TEXT(
         _dts,
          _frmt
     ) & " to " & TEXT(
         _eDts,
          _frmt
     ),     _srt,
     SORT(
         HSTACK(
             _cust,
              _rngDts,
              _tqty
         ),
          {1,
          3},
          {1,
          -1}
     ),     _rtrn,
     GROUPBY(
         TAKE(
             _srt,
              ,
              1
         ),
          DROP(
             _srt,
              ,
              1
         ),
          SINGLE,
          0,
          0
     ),     _rtrn)
Excel solution 3 for Golden Period!, proposed by Oscar Mendez Roca Farell:
=LET(
    F,
     LAMBDA(
         i,
          TEXT(
              i,
              "e-mm-dd"
          )
     ),
     c,
     C3:C26,
     d,
     B3:B26,
     m,
     HSTACK(
         c,
          F(
              d
          )&" to "&F(
              d+9
          ),
          MAP(
              c,
               d,
               LAMBDA(
                   a,
                    b,
                    SUMIFS(
                        D3:D26,
                         c,
                         a,
                         d,
                         ">="&b,
                         d,
                        "<"&b+9
                    )
               )
          )
     ),
     REDUCE(
         F2:H2,
          UNIQUE(
              c
          ),
          LAMBDA(
              i,
               x,
               VSTACK(
                   i,
                    TAKE(
                        SORT(
                            FILTER(
                                m,
                                 c=x
                            ),
                             3,
                             -1
                        ),
                         1
                    )
               )
          )
     )
)
Excel solution 4 for Golden Period!, proposed by Julian Poeltl:
=LET(D,
    B3:B26,
    C,
    C3:C26,
    Q,
    D3:D26,
    REDUCE(HSTACK(
        "Customer",
        "Period",
        "Total Qty"
    ),
    UNIQUE(
        C
    ),
    LAMBDA(A,
    B,
    VSTACK(A,
    LET(FD,
    FILTER(
        D,
        C=B
    ),
    FQ,
    FILTER(
        Q,
        C=B
    ),
    R,
    MAP(FD,
    LAMBDA(A,
    SUM(FILTER(FQ,
    (FD>=A)*(FD
Excel solution 5 for Golden Period!, proposed by Kris Jaganah:
=REDUCE({"Customer",
    "Period",
    "Total Qty"},
    UNIQUE(
        C3:C26
    ),
    LAMBDA(v,
    w,
    VSTACK(v,
    LET(a,
    B3:B26,
    b,
    C3:C26,
    c,
    D3:D26,
    d,
    MIN(
        XLOOKUP(
            w,
            b,
            a
        )
    ),
    e,
    SEQUENCE(
        MAX(
            a
        )-d+1,
        ,
        d
    ),
    f,
    MAP(e,
    LAMBDA(x,
    SUM((a=x)*(b=w)*c))),
    g,
    MAP(
        e,
        LAMBDA(
            z,
            SUM(
                TAKE(
                    FILTER(
                        f,
                        e<=z
                    ),
                    -10
                )
            )
        )
    ),
    h,
    MAX(
        g
    ),
    i,
    XLOOKUP(
        h,
        g,
        e,
        ,
        ,
        -1
    ),
    j,
    "yy-mm-dd",
    HSTACK(
        w,
        TEXT(
            i-9,
            j
        )&" to "&TEXT(
            i,
            j
        ),
        h
    )))))
Excel solution 6 for Golden Period!, proposed by Imam Hambali:
=LET(    d,
     B3:B26,    c,
     C3:C26,    q,
     D3:D26,    t,
     d+9,    acc,
     SUMIFS(
         q,
         c,
         "="&c,
         d,
         ">="&d,
         d,
         "<="&t
     ),    f,
     HSTACK(
         c,
          TEXT(
              d,
              "yyyy-mm-dd"
          )&" to "&TEXT(
              t,
              "yyyy-mm-dd"
          ),
         acc
     ),    s,
     SORT(
         f,
         {1,
         3},
         {1,
         -1}
     ),    VSTACK(
        Solution[        #Headers],
         FILTER(
             s,
              TAKE(
                  s,
                  ,
                  1
              )<>DROP(
                  VSTACK(
                      0,
                       TAKE(
                  s,
                  ,
                  1
              )
                  ),
                  -1,

              )
         )
    ))
Excel solution 7 for Golden Period!, proposed by Sunny Baggu:
=LET(
 _u,
     UNIQUE(
         C3:C26
     ), REDUCE(
 {"Customer",
     "Period",
     "Total Qty"}, _u, LAMBDA(x,
     y, VSTACK(
 x, LET(
 _a,
     FILTER(
         B3:B26,
          C3:C26 = y
     ), _b,
     _a + 9, _c,
     MAP(
 _a, _b, LAMBDA(a,
     b,
     SUM((B3:B26 >= a) * (B3:B26 <= b) * (C3:C26 = y) * D3:D26))
 ), _d,
     FILTER(
         HSTACK(
             _a,
              _b,
              _c
         ),
          _c = MAX(
              _c
          )
     ), HSTACK(      y,      TEXT(
          INDEX(
              _d,
               ,
               1
          ),
           "yy-mm-dd"
      ) & " to " &
      TEXT(
          INDEX(
              _d,
               ,
               2
          ),
           "yy-mm-dd"
      ),      TAKE(
          _d,
           ,
           -1
      ) )
 )
 )
 )
 )
)
Excel solution 8 for Golden Period!, proposed by Diarmuid Early:
=LET(dt,
    B3:B26,
     cust,
    C3:C26,
     qt,
    D3:D26, periodSales,
    SUMIFS(
        qt,
        dt,
        ">="&dt,
        dt,
        "<="&dt+9,
        cust,
        cust
    ), uniCust,
    UNIQUE(
        cust
    ), custFilt,
     cust=TOROW(
         uniCust
     ), maxSales,
     BYCOL(
         custFilt*periodSales,
         MAX
     ), maxSalStDt,
     BYCOL(custFilt*(periodSales=maxSales)*dt,
    MAX), HSTACK(
     uniCust,
     TOCOL(
         TEXT(
             maxSalStDt,
             "yy-mm-dd"
         )&" to "&TEXT(
             maxSalStDt+9,
             "yy-mm-dd"
         )
     ),
     TOCOL(
         maxSales
     )
 ))
Excel solution 9 for Golden Period!, proposed by Hamidi Hamid:
=LET(
    bb,
    $B$3:$B$26,
    cc,
    $C$3:$C$26,
    dd,
    $D$3:$D$26,
    u,
    UNIQUE(
        cc
    ),
    x,
    SEQUENCE(
        ,
        10,
        MIN(
            bb
        )-1,
        1
    ),
    e,
    x+SEQUENCE(
        MAX(
            bb
        )-MIN(
            bb
        )+1
    ),
    t,
    TOCOL(
        x+SEQUENCE(
        MAX(
            bb
        )-MIN(
            bb
        )+1
    )
    ),
    w,
    WRAPROWS(
        SUMIFS(
            dd,
            bb,
            t,
            $C$3:$C$26,
            CHAR(
                ROW(
                    1:1
                )+64
            )
        ),
        10
    ),
    f,
    MAX(
        BYROW(
            w,
            SUM
        )
    ),
    s,
    TAKE(
        SORT(
            HSTACK(
                TAKE(
                    e,
                    ,
                    1
                ),
                TAKE(
                    e,
                    ,
                    -1
                ),
                BYROW(
            w,
            SUM
        )
            ),
            3,
            -1
        ),
        1
    ),
    k,
    CHOOSECOLS(
        TAKE(
            SORT(
                HSTACK(
                    SEQUENCE(
                        ROWS(
                            e
                        ),
                        ,
                        1,
                        1
                    ),
                    e,
                    BYROW(
            w,
            SUM
        )
                ),
                {12,
                1},
                1
            ),
            -1
        ),
        2,
        11,
        12
    ),
    HSTACK(
        TEXT(
            CHOOSECOLS(
                k,
                1
            ),
            "yy-mm-dd"
        )&" to "&TEXT(
            CHOOSECOLS(
                k,
                2
            ),
            "yy-mm-dd"
        ),
        TAKE(
            k,
            ,
            -1
        )
    )
)
Excel solution 10 for Golden Period!, proposed by Jeremy Freelove:
=REDUCE({"Customer",
    "Period",
    "Total Qty"}, UNIQUE(
     t[Customer]
 ), LAMBDA(a,
    c,
    LET(
 startDates,
    SEQUENCE(         MAX(
             t[Date]
         )-MIN(
             t[Date]
         )-8,
        ,         MIN(
             t[Date]
         )
    ), totals,
    MAP(startDates,
    LAMBDA(s, SUM(FILTER(t[Qty], (t[Customer]=c)
 *(t[Date]>=s)
 *(t[Date]<=s+9), 0)))), start,
    TAKE(
        FILTER(
            startDates,
            totals=MAX(
                totals
            )
        ),
        1
    ), VSTACK(
     a,      HSTACK(
          c,           TEXT(
               start,
               "YY-MM-DD"
           )
           &" to "
           &TEXT(
               start+9,
               "YY-MM-DD"
           ),           MAX(
                totals
            )
      )
 ))))
Excel solution 11 for Golden Period!, proposed by LEONARD OCHEA 🇷🇴:
=LET(a,
    B3:B26,
    b,
    C3:C26,
    c,
    D3:D26,
    I,
    CHOOSECOLS,
    t,
    MAP(a,
    b,
    LAMBDA(x,
    y,
    SUM(FILTER(c,
    (b=y)*(a=x),
    0)))),
    g,
    GROUPBY(
        b,
        t,
        MAX,
        ,
        0
    ),
    m,
    I(
        g,
        1
    ),
    n,
    I(
        g,
        2
    ),
    f,
    XLOOKUP(
        m&n,
        b&t,
        a
    ),
    HSTACK(
        m,
        TEXT(
            f,
            "e-mm-dd"
        )&" to "&TEXT(
            f+9,
            "e-mm-dd"
        ),
        n
    ))
Excel solution 12 for Golden Period!, proposed by Md. Zohurul Islam:
=LET(    dt,
    B3:B26,    cust,
    C3:C26,    qty,
    D3:D26,    edt,
    dt+9,    dtfrmt,
    "yy-mm-dd",    result,
    SUMIFS(
        qty,
        cust,
        cust,
        dt,
        ">="&dt,
        dt,
        "<="&edt
    ),    txt,
    TEXT(
        dt,
        dtfrmt
    ) & " to " & TEXT(
        edt,
        dtfrmt
    ),    rng,
    HSTACK(
        cust,
        txt,
        result
    ),    P,
    SORT(
        rng,
        {1,
        3},
        {1,
        -1}
    ),    Q,
    UNIQUE(
        SORT(
            cust
        )
    ),    S,
    REDUCE(
        {"Customer",
        "Period",
        "Total Qty"},
        Q,
        LAMBDA(
            y,
            x,
            LET(
                a,
                FILTER(
                    P,
                    TAKE(
                        P,
                        ,
                        1
                    )=x
                ),
                b,
                TAKE(
                    a,
                    ,
                    -1
                ),
                d,
                FILTER(
                    a,
                    b=MAX(
                        b
                    )
                ),
                e,
                VSTACK(
                    y,
                    d
                ),
                e
            )
        )
    ),    S
)
Solving the challenge of Golden Period! with Python in Excel
Python in Excel solution 1 for Golden Period!, proposed by Alejandro Campos:
df = xl("B2:D26", headers=True)
df['Date'] = pd.to_datetime(df['Date'], format='%d/%m/%Y')

result = (df.groupby(['Date', 'Customer'], as_index=False)['Qty'].sum()
 .set_index('Date')
 .groupby('Customer')
 .apply(lambda x: x.reindex(pd.date_range(x.index.min(), "2024-11-01", freq='D')))
 .reset_index(level=0, drop=True)
 .reset_index()
 .assign(Qty=lambda df: df['Qty'].fillna(0),
 Customer=lambda df: df['Customer'].ffill())
 .assign(rolling_sum=lambda df: df.groupby('Customer')['Qty'].rolling(10, min_periods=10).sum().reset_index(0, drop=True))
 .pipe(lambda df: df[df.groupby('Customer')['rolling_sum'].transform('max') == df['rolling_sum']])
 .groupby('Customer').tail(1)
 .assign(min_date=lambda df: (df['index'] - pd.Timedelta(days=9)).dt.strftime('%y-%m-%d'),
 Date=lambda df: df['index'].dt.strftime('%y-%m-%d'),
 Period=lambda df: df['min_date'] + ' to ' + df['Date'])
 [['Customer', 'Period', 'rolling_sum']]
 .rename(columns={'rolling_sum': 'Total Qty'})
 .reset_index(drop=True))
Solving the challenge of Golden Period! with R
R solution 1 for Golden Period!, proposed by Konrad Gryczan, PhD:
library(tidyverse)
library(readxl)
library(slider)

path = "files/CH-140 Golden Period.xlsx"
input = read_excel(path, range = "B2:D26")
test = read_excel(path, range = "F2:H5")

result = input %>%
 summarise(Qty = sum(Qty), .by = c(Date, Customer)) %>%
 group_by(Customer) %>%
 complete(Date = seq.Date(min(as.Date(Date)), as.Date("2024/11/01"), by = "1 day")) %>%
 left_join(input) %>%
 replace_na(list(Qty = 0)) %>%
 group_by(Customer) %>%
 mutate(rolling_sum = slide_dbl(Qty, sum, .before = 9, .complete = TRUE)) %>%
 filter(rolling_sum == max(rolling_sum, na.rm = T)) %>%
 filter(Date == max(Date, na.rm = T)) %>%
 mutate(min_date = Date - days(9)) %>%
 select(Customer, min_date, Date, `Total Qty` = rolling_sum) %>%
 mutate(min_date = format(min_date, "%y-%m-%d"), Date = format(Date, "%y-%m-%d")) %>%
 unite("Period", min_date, Date, sep = " to ")

all.equal(result, test, check.attributes = F)
#> [1] TRUE
Solving the challenge of Golden Period! with Google Sheets
Google Sheets solution 1 for Golden Period!, proposed by Peter Krkos:
PowerQuery solution:
https://docs.google.com/spreadsheets/d/1zR5IZLz8OT76vhaPEHfsPrw8-RDKnLyyqS49IJjdhFk/edit?pli=1&gid=1046065244#gid=1046065244