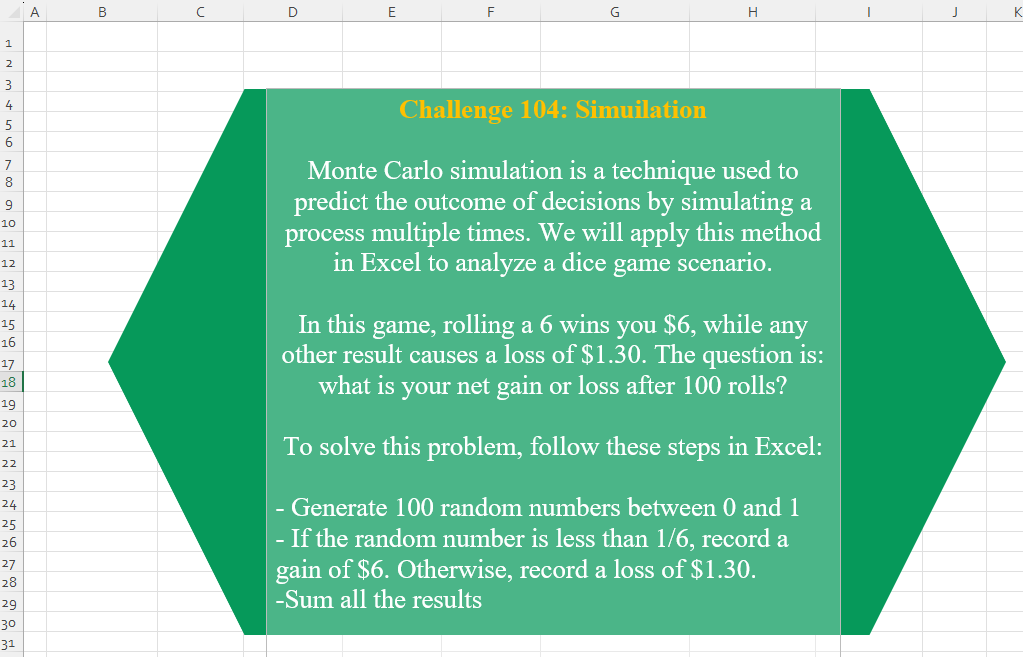
Monte Carlo simulation is a technique used to predict the outcome of decisions by simulating a process multiple times. We will apply this method in Excel to analyze a dice game scenario. In this game, rolling a 6 wins you $6, while any other result causes a loss of $1.30. The question is: what is your net gain or loss after 100 rolls? To solve this problem, follow these steps in Excel: – Generate 100 random numbers between 0 and 1 – If the random number is less than 1/6, record a gain of $6. Otherwise, record a loss of $1.30. -Sum all the results
📌 Challenge Details and Links
Challenge Number: 104
Challenge Difficulty: ⭐⭐⭐
📥Download Sample File
📥Link to the solutions on LinkedIn
Solving the challenge of Simuilation! with Power Query
Power Query solution 1 for Simuilation!, proposed by Zoran Milokanović:
let
  Source = List.Sum(List.Transform(List.Random(100), each {- 1.30, 6}{Byte.From(_ < 1 / 6)}))
in
  Source
Power Query solution 2 for Simuilation!, proposed by Yaroslav Drohomyretskyi:
let
  Source = List.Sum(List.Transform(List.Random(100), each if _ < 1 / 6 then 6 else - 1.3))
in
  Source
Solving the challenge of Simuilation! with Excel
Excel solution 1 for Simuilation!, proposed by Julian Poeltl:
=SUM(
    IF(
        RANDARRAY(
            100
        )<1/6,
        6,
        -1.3
    )
)
Excel solution 2 for Simuilation!, proposed by Julian Poeltl:
=SUM(
    IF(
        RANDARRAY(
            100,
            ,
            1,
            6,
            1
        )=6,
        6,
        -1.3
    )
)
Excel solution 3 for Simuilation!, proposed by Kris Jaganah:
=SUM(
    IF(
        RANDARRAY(
            100,
            1,
            1,
            6,
            1
        )=6,
        6,
        -1.3
    )
)
Excel solution 4 for Simuilation!, proposed by Abdallah Ally:
=REDUCE(0,SEQUENCE(100),LAMBDA(x,y,x+IF(RANDBETWEEN( 1,6)=6,6,-1.3)))Excel solution 5 for Simuilation!, proposed by Imam Hambali:
=SUM(IF(RANDARRAY(
    100
)<(1/6),
    6,
    -1.3))
Excel solution 6 for Simuilation!, proposed by Sunny Baggu:
=LET(
 n, RANDARRAY(100),
 SUM(N("Omid Motamedisedeh😊") + IF(n < 1 / 6, 6, -1.3))
)
Excel solution 7 for Simuilation!, proposed by Andy Heybruch:
=SUM(IF(RANDARRAY(
    100,
    ,
    0,
    1
)<(1/6),
    6,
    -1.3))
Excel solution 8 for Simuilation!, proposed by Bilal Mahmoud kh.:
=SUM(MAP(SEQUENCE(
    100
),
    LAMBDA(x,
    IF(RAND() < (1/6),
    6,
    -1.3))))
Excel solution 9 for Simuilation!, proposed by ferhat CK:
=LET(a,
    BYROW(
        SEQUENCE(
            100
        ),
        LAMBDA(
            x,
            RANDBETWEEN(
                1,
                6
            )
        )
    ),
    b,
    IFNA(XMATCH(
        a,
        6
    )*6,
    XMATCH(
        a,
        SEQUENCE(
            5
        )
    )*(-1.3)),
    VSTACK(
        "Sum:" & SUM(
            b
        ),
        b
    ))
Excel solution 10 for Simuilation!, proposed by Jeremy Freelove:
=SUM(7.3*(RANDARRAY(
    100,
    ,
    0,
    6
)>1)-1.3)
Excel solution 11 for Simuilation!, proposed by LEONARD OCHEA 🇷🇴:
=LET(
    n,
    10^7,
    F,
    LAMBDA(
        F,
        a,
        b,
        LET(
            c,
            b+IF(
                RAND()<1/6,
                6,
                -1.3
            ),
            IF(
                a=n,
                c,
                F(
                    F,
                    a+1,
                    c
                )
            )
        )
    ),
    F(
        F,
        ,    )
)
Excel solution 12 for Simuilation!, proposed by Nicolas Micot:
=LET(
    _pop;
    SEQUENCE(
        100
    );
    _values;
    MAP(
        _pop;
        LAMBDA(
            l_pop;
            ALEA.ENTRE.BORNES(
                1;
                6
            )
        )
    );
    SOMME(
        SI(
            _values=6;
            6;
            -1.3
        )
    )
)
Excel solution 13 for Simuilation!, proposed by Peter Bartholomew:
=LET(     throw,
     RANDARRAY(
         nGames,
          100,
          1,
          6,
          1
     ),     gains,
     IF(
         throw = 6,
          6,
          -1.3
     ),     BYROW(
         gains,
          SUM
     ))
This aimed to simulate the logic of the dice roll more closely and I ran the game for 10,
    000 games at a time (nGames=10,
    000)
Excel solution 14 for Simuilation!, proposed by Pieter de B.:
=SUM(
    IF(
        RANDARRAY(
            100,
            ,
            0,
            1
        )<1/6,
        6,
        -1.3
    )
)
Excel solution 15 for Simuilation!, proposed by Rick Rothstein:
=SUM(
    IF(
        6*RANDARRAY(
            100
        )<1,
        6,
        -1.3
    )
)
Solving the challenge of Simuilation! with Python
Python solution 1 for Simuilation!, proposed by Konrad Gryczan, PhD:
import numpy as np

monte_carlo_simulation = lambda n: np.sum(np.where(np.random.rand(n) < 1/6, 6, -1.3))

monte_carlo_simulation(100)
Solving the challenge of Simuilation! with Python in Excel
Python in Excel solution 1 for Simuilation!, proposed by Owen Price:
nother Python in Excel solution for the bag

np.random.seed(42)
np.sum(np.where(np.random.rand(100) < 1/6, 6, -1.3))
Python in Excel solution 2 for Simuilation!, proposed by Abdallah Ally:
import randint

sum(6 if randint(1, 6) == 6 else -1.3 for _ in range(100))
Python in Excel solution 3 for Simuilation!, proposed by Alejandro Campos:
ashtag
#PythonExcel

num_rolls = 100
random_numbers = np.random.rand(num_rolls)
results = np.where(random_numbers < 1/6, 6, -1.30)
results.sum()
Solving the challenge of Simuilation! with R
R solution 1 for Simuilation!, proposed by Brian Julius:
library(ggplot2)
library(ggpubr)

set.seed(345)

simulate_trial <- function() {
 rolls <- sample(1:6, 100, replace = TRUE)
 winnings <- ifelse(rolls == 6, 6, -1.3)
 return(sum(winnings))
}

num_trials <- 50000
results <- sapply(1:num_trials, function(x) simulate_trial())

df_sim <- data.frame(
 "Trial" = 1:num_trials,
 "NetResult" = results
)

summ <- summary(df_sim)
df_sim

num_bins <- 32
mean_value <- mean(df_sim$NetResult)

hist_plot <- ggplot(df_sim, aes(x = NetResult)) +
 geom_histogram(bins = round(num_bins),
 color = "blue",
 fill = "lightblue") +
 geom_vline(xintercept = mean_value, color = "red", linetype = "dashed") +
 labs(title = "Histogram of Net Result (Each trial = 100 rolls, 50000 trials") +
 theme_minimal()

print(hist_plot)
print(summ)
R solution 2 for Simuilation!, proposed by Konrad Gryczan, PhD:
 Solution Done
hashtag
#RStats
hashtag
#ExcelChallenge

monte_carlo_simulation <- function(n) {
 sum(ifelse(runif(n) < 1/6, 6, -1.3))
}

monte_carlo_simulation(100)