
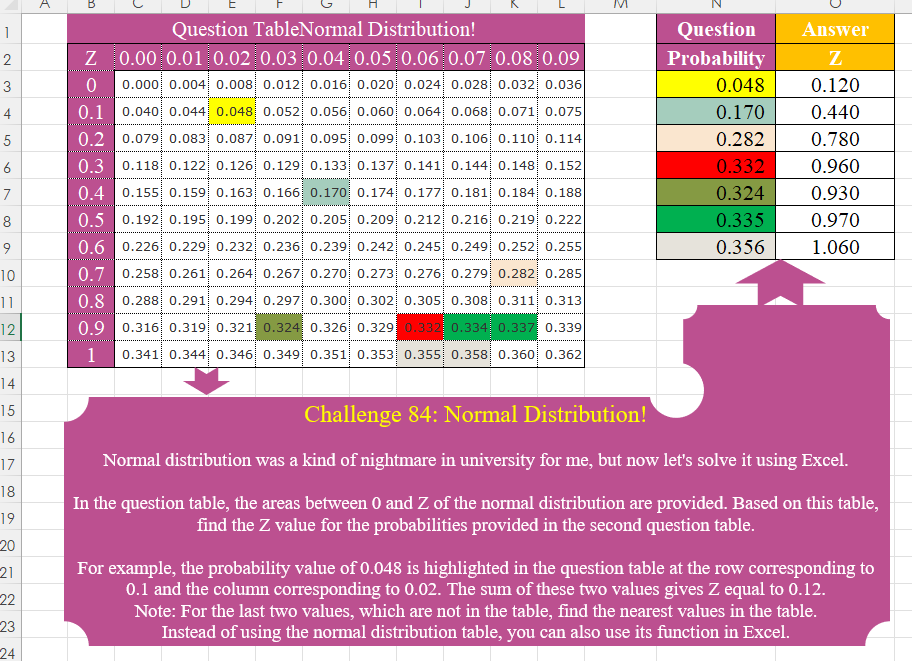
Normal distribution was a kind of nightmare in university for me, but now let’s solve it using Excel. In the question table, the areas between 0 and Z of the normal distribution are provided. Based on this table, find the Z value for the probabilities provided in the second question table. For example, the probability value of 0.048 is highlighted in the question table at the row corresponding to 0.1 and the column corresponding to 0.02. The sum of these two values gives Z equal to 0.12. Note: For the last two values, which are not in the table, find the nearest values in the table. Instead of using the normal distribution table, you can also use its function in Excel.
📌 Challenge Details and Links
Challenge Number: 84
Challenge Difficulty: ⭐⭐
📥Download Sample File
📥Link to the solutions on LinkedIn
Solving the challenge of Normal Distribution! with Power Query
Power Query solution 1 for Normal Distribution!, proposed by Zoran Milokanović:
let
  Source = each Excel.CurrentWorkbook(){[Name = _]}[Content],
  S = Table.AddColumn(
    Source("Table2"),
    "Z",
    each
      let
        N = Table.UnpivotOtherColumns(Source("Table1"), {"Z"}, "A", "V"),
        M = Table.SelectRows(
          N,
          (r) =>
            Number.Abs(r[V] - [Probability])
              = List.Min(List.Transform(N[V], (m) => Number.Abs(m - [Probability])))
        ){0}
      in
        M[Z] + Number.From(M[A])
  )
in
  S
Power Query solution 2 for Normal Distribution!, proposed by Alejandro Simón 🇵🇦 🇪🇸:
let
Source = Excel.CurrentWorkbook(){[Name="Table1"]}[Content],
Prob = Excel.CurrentWorkbook(){[Name="Table2"]}[Content],
Sol = Table.AddColumn(Prob, "Z", (x)=>
try
let
a = Source,
b = List.PositionOf(List.Transform(Table.ToColumns(a), each List.Contains(_, x[Probability])), true),
c = List.PositionOf(List.Transform(Table.ToRows(a), each List.Contains(_, x[Probability])), true),
d = Number.From(Table.ColumnNames(Source){b})+Table.ToColumns(Source){0}{c}
in d
otherwise
let
e = List.Last(Table.ToColumns(Source)),
f = List.Count(List.Select(e, each _x[Probability])),
j = if x[Probability] - h < i - x[Probability] then h else i,
k = g{0} + Number.From(Table.ColumnNames(Source){List.PositionOf(g,j)})
in k)
in
Sol
Power Query solution 3 for Normal Distribution!, proposed by Alejandro Simón 🇵🇦 🇪🇸:
let
Source = Excel.CurrentWorkbook(){[Name="Table1"]}[Content],
Unpivot = Table.UnpivotOtherColumns(Source, {"Z"}, "A", "V"),
Prob = Excel.CurrentWorkbook(){[Name="Table2"]}[Content],
Sol = Table.AddColumn(Prob, "Z", (x)=>
try let
a = Unpivot,
b = Table.ToRows(Table.SelectRows(a, each [V]=x[Probability])){0},
c = b{0}+Number.From(b{1})
in c
otherwise
let
d = List.Last(List.Select(Unpivot[V], each _ < x[Probability])),
e = List.First(List.Select(Unpivot[V], each _ > x[Probability])),
f = if x[Probability] - d < e - x[Probability] then d else e,
g = Table.ToRows(Table.SelectRows(Unpivot, each [V]=f)){0},
h = g{0}+Number.From(g{1})
in h)
in
Sol
Power Query solution 4 for Normal Distribution!, proposed by Kris Jaganah:
let
  T1 = Excel.CurrentWorkbook(){[Name = "Table1"]}[Content],
  T2 = Excel.CurrentWorkbook(){[Name = "Table2"]}[Content],
  U = Table.UnpivotOtherColumns(T1, {"Z"}, "A", "V"),
  S = Table.AddColumn(U, "S", each [Z] + Number.From([A])),
  A = Table.AddColumn(T2, "Z", each List.Last(Table.SelectRows(S, (x) => x[V] <= [Probability])[S])),
  T = Table.TransformColumnTypes(A, {{"Probability", type number}, {"Z", type number}})
in
  T
Power Query solution 5 for Normal Distribution!, proposed by Arnaud Duvernois:
let
 Source = Excel.CurrentWorkbook(){[Name="TableDistribution"]}[Content],
 Unpivot = Table.UnpivotOtherColumns(Source, {"Z"}, "Attribut", "Valeur"),
 Type = Table.TransformColumns(Unpivot , {} , each Number.From(_,"en-US"))
in
 Type

let
 Source = Excel.CurrentWorkbook(){[Name="Question"]}[Content],
 Type = Table.TransformColumns(Source,{}, each Number.From(_,"en-US")),
 AddCorresp = Table.AddColumn(Type, "Corresp", each List.Max(List.Select(List.Sort(Tableau2[Valeur],0), (x) => [Probability] - x >=0))),
 Join = Table.NestedJoin(AddCorresp, {"Corresp"}, Tableau2, {"Valeur"}, "Tableau2", JoinKind.LeftOuter),
 ExpandJoin = Table.ExpandTableColumn(Join, "Tableau2", {"Z", "Attribut"}, {"Z", "Attribut"}),
 Answer = Table.AddColumn(ExpandJoin, "Answer", each [Z]+[Attribut]),
 ColSupp = Table.RemoveColumns(Answer,{"Corresp", "Z", "Attribut"})
in
 ColSupp
Power Query solution 6 for Normal Distribution!, proposed by Szabolcs Phraner:
let
Source = ...,
 // Z Value is calculated by combining the value of field "Z" with " + " and the Field Name Related to the Probability, then Evaluating this string as an expression. Z Values and Probability Values are Zipped toegther and transformed into a two columned table at the end.
 GetProbabilities = Table.TransformRows( Source,
each
[
Row = _,
RemoveFirstField = Record.RemoveFields(Row,{"Z"}),
Probabilities =List.Transform( Record.FieldValues(RemoveFirstField), each Number.From(_,"en-US")),
ZValues = Record.FieldValues( Record.TransformFields(RemoveFirstField, List.Transform( Record.FieldNames(RemoveFirstField), (fn)=> {fn, each Number.Round( Expression.Evaluate( Row[Z] & " + " & fn ),3) }) ) ),
 ProbabilityTable = Table.FromRows( List.Zip({Probabilities, ZValues}), {"Probability","Z"} )
] [ProbabilityTable]
),
 Append = Table.Combine( GetProbabilities ),
 Buffer = Table.Buffer( Append )
in
 Buffer

Final Result in Next comment
Solving the challenge of Normal Distribution! with Excel
Excel solution 1 for Normal Distribution!, proposed by Bo Rydobon 🇹🇭:
=NORMSINV(
    N3:N9+0.5
)

=ROUND(
    NORMSINV(
    N3:N9+0.5
),
    2
)
Excel solution 2 for Normal Distribution!, proposed by محمد حلمي:
=LOOKUP(
    N3:N9,
    TOCOL(
        C3:L13
    ),
    TOCOL(
        C2:L2+B3:B13
    )
)
Excel solution 3 for Normal Distribution!, proposed by Oscar Mendez Roca Farell:
=XLOOKUP(
    N3:N9,
     TOCOL(
         C3:L13
     ),
     TOCOL(
         B3:B13+C2:L2
     ),
     ,
     -1
)
Excel solution 4 for Normal Distribution!, proposed by Julian Poeltl:
=LET(
    C,
    N3:N9,
    T,
    --TEXTSPLIT(
        TEXTJOIN(
            "§",
            ,
            TOCOL(
                C3:L13&"|"&C2:L2+B3:B13
            )
        ),
        "|",
        "§"
    ),
    P,
    TAKE(
        T,
        ,
        1
    ),
    Z,
    TAKE(
        T,
        ,
        -1
    ),
    S,
    XLOOKUP(
        C,
        P,
        P,
        ,
        -1
    ),
    L,
    XLOOKUP(
        C,
        P,
        P,
        ,
        1
    ),
    XLOOKUP(
        IF(
            ABS(
                C-L
            )>ABS(
                C-S
            ),
            S,
            L
        ),
        P,
        Z
    )
)
Excel solution 5 for Normal Distribution!, proposed by Julian Poeltl:
=LET(
    T,
    L_Flattena2DTableintoColumns(
        B2:L13
    ),
    MAP(
        N3:N9,
        LAMBDA(
            A,
            L_XLOOKUPNearestValue(
                A,
                TAKE(
                    T,
                    ,
                    -1
                ),
                BYROW(
                    TAKE(
                        T,
                        ,
                        2
                    ),
                    LAMBDA(
                        A,
                        SUM(
                            A
                        )
                    )
                )
            )
        )
    )
)

Pre-programmed Lambdas:
 L_Flattena2DTableintoColumns:
=LAMBDA(Table,
    LET(rows,
    ROWS(
        DROP(
            Table,
            1,
            1
        )
    ),
    COLUMNS,
    COLUMNS(
        DROP(
            Table,
            1,
            1
        )
    ),
    HRows,
    CHOOSEROWS(TAKE(
        Table,
        -rows,
        1
    ),
    (ROUNDDOWN(
        SEQUENCE(
            rows*COLUMNS,
            ,
            0
        )/COLUMNS,
        0
    )+1)),
    HColumn,
    CHOOSEROWS(
        TOCOL(
            TAKE(
                Table,
                1,
                -COLUMNS
            )
        ),
        L_RepeatingNumberSequence(
            COLUMNS,
            rows
        )
    ),
    Data,
    TOCOL(
        DROP(
            Table,
            1,
            1
        )
    ),
    HSTACK(
        HRows,
        HColumn,
        Data
    )))

L_XLOOKUPNearestValue:
 =LAMBDA(SearchValue,
    SearchMatrix,
    ReturnMatrix,
    (LET(
        SA,
        SearchMatrix,
        ra,
        ReturnMatrix,
        s,
         SearchValue,
        XNK,
        IFERROR(
            XLOOKUP(
                s,
                SA,
                ra,
                ,
                -1
            ),
            XLOOKUP(
                s,
                SA,
                ra,
                ,
                1
            )
        ),
        XNG,
        IFERROR(
            XLOOKUP(
                s,
                SA,
                ra,
                ,
                1
            ),
            XLOOKUP(
                s,
                SA,
                ra,
                ,
                -1
            )
        ),
        VNK,
        XLOOKUP(
            XNK,
            ra,
            SA,
            ,
            0
        ),
        VNG,
        XLOOKUP(
            XNG,
            ra,
            SA,
            ,
            0
        ),
        DiffNK,
        ABS(
            s-VNK
        ),
        DiffNG,
        ABS(
            s-VNG
        ),
        MIN,
        MIN(
            DiffNG,
            DiffNK
        ),
        ChooseMIN,
        XMATCH(
            MIN,
            HSTACK(
                DiffNK,
                DiffNG
            ),
            0
        ),
        IF(
            ChooseMIN=1,
            XNK,
            XNG
        )
    )))
Excel solution 6 for Normal Distribution!, proposed by Kris Jaganah:
=MAP(N3:N9,
    LAMBDA(x,
    LET(a,
    C3:L13,
    b,
    B3:B13,
    c,
    C2:L2,
    d,
    SCAN(
        ,
        IFNA(
            MATCH(
                a,
                x,
                -1
            ),
            -1
        ),
        SUM
    ),
    SUM((MAX(
        d
    )=d)*(b+c)))))
Excel solution 7 for Normal Distribution!, proposed by Abdallah Ally:
=XLOOKUP(
    N3:N9,
    TOCOL(
        C3:L13
    ),
    TOCOL(
        C2:L2+B3:B13
    ),
    ,
    -1
)
Excel solution 8 for Normal Distribution!, proposed by Imam Hambali:
=LET(    a,
     TEXTSPLIT(
         TEXTJOIN(
             ",",
             TRUE,
             C2:L2&"-"&B3:B13&"-"&C3:L13
         ),
         "-",
         ","
     )*1,    b,
     BYROW(
         N3:N9,
          LAMBDA(
              x,
               SUM(
                   XLOOKUP(
                       x,
                       TAKE(
                           a,
                           ,
                           -1
                       ),
                       TAKE(
                           a,
                           ,
                           2
                       ),
                       ,
                       -1
                   )
               )
          )
     ),    b)
Excel solution 9 for Normal Distribution!, proposed by Sunny Baggu:
=MAP(     N3:N9,     LAMBDA(
         x,          LET(

               a,
               TOCOL(
                   C3:L13
               ),

               MAX(
                   IF(
                       C3:L13 = XLOOKUP(
                           x,
                            a,
                            a,
                            ,
                            -1
                       ),
                        B3:B13 + C2:L2,
                        0
                   )
               )

          )     ))
Excel solution 10 for Normal Distribution!, proposed by Bilal Mahmoud kh.:
=MAP(
    N3:N9,
    LAMBDA(
        n,
        LET(
            a,
            C3:L13-n,
            TEXTJOIN(
                "",
                TRUE,
                MAP(
                    SEQUENCE(
                        11
                    ),
                    LAMBDA(
                        x,
                        CONCAT(
                            MAP(
                                SEQUENCE(
                                    10
                                ),
                                LAMBDA(
                                    y,
                                    IF(
                                        ABS(
                                            INDEX(
                                                a,
                                                x,
                                                y
                                            )
                                        )=MIN(
                                            ABS(
                                                a
                                            )
                                        ),
                                        INDEX(
                                            B3:B13,
                                            x,
                                            1
                                        )+INDEX(
                                            C2:L2,
                                            1,
                                            y
                                        ),
                                        ""
                                    )
                                )
                            )
                        )
                    )
                )
            )
        )
    )
)
Excel solution 11 for Normal Distribution!, proposed by CA Raghunath Gundi:
=LET(
    row,
    B3:B13,
    col,
    C2:L2,
    data,
    C3:L13,
    prob,
    N3:N9,    XLOOKUP(
        prob,
        TOCOL(
            data
        ),
        TOCOL(
            row + col
        ),
        ,
        -1
    )
)
Excel solution 12 for Normal Distribution!, proposed by Eddy Wijaya:
=LET(    zScore,
    SEQUENCE(
        110,
        ,
        0,
        0.01
    ),    prob,
    TOCOL(
        C3:L13
    ),    db,
    HSTACK(
        prob,
        zScore
    ),    question,
    N3:N9,    answer,
    VSTACK(
        {"Question",
        "Answer"},
        {"Probability",
        "Z"},
        HSTACK(
            question,
            XLOOKUP(
                question,
                TAKE(
                    db,
                    ,
                    1
                ),
                TAKE(
                    db,
                    ,
                    -1
                ),
                ,
                -1
            )
        )
    ),    answer
)
Excel solution 13 for Normal Distribution!, proposed by ferhat CK:
=HSTACK(
    N3:N9,
    TOCOL(
        MAP(
            C3:L13,
            LAMBDA(
                x,
                IF(
                    OR(
                        x=BYROW(
                            N3:N9,
                            LAMBDA(
                                x,
                                MAX(
                                    IF(
                                        C3:L13<=x,
                                        C3:L13
                                    )
                                )
                            )
                        )
                    ),
                    INDEX(
                        B3:B13,
                        ROW(
                            x
                        )-2
                    )+INDEX(
                        C2:L2,
                        ,
                        COLUMN(
                            x
                        )-2
                    ),
                    1/0
                )
            )
        ),
        3
    )
)
Excel solution 14 for Normal Distribution!, proposed by ferhat CK:
=LET(
    a,
    VSTACK(
        TOCOL(
            C3:L13
        ),
        TOCOL(
            MAKEARRAY(
                11,
                10,
                LAMBDA(
                    x,
                    y,
                    SUM(
                        INDEX(
                            B3:B13,
                            x
                        ),
                        INDEX(
                            C2:L2,
                            ,
                            y
                        )
                    )
                )
            )
        )
    ),
    b,
    N3:N9,
    HSTACK(
        b,
        XLOOKUP(
            b,
            INDEX(
                a,
                ,
                1
            ),
            INDEX(
                a,
                ,
                2
            ),
            ,
            -1
        )
    )
)
Excel solution 15 for Normal Distribution!, proposed by Hamidi Hamid:
=LET(
    q,
    TOCOL(
        IFNA(
            B3:B13,
            C3:L13
        )
    ),
    r,
    TOCOL(
        IFNA(
            C2:L2,
            C3:L13
        )
    ),
    t,
    TOCOL(
        IFNA(
            C3:L13,
            B3:B13
        )
    ),
    g,
    q+r,
    XLOOKUP(
        N3:N9,
        t,
        g,
        0,
        -1
    )
)
Excel solution 16 for Normal Distribution!, proposed by Hussein SATOUR:
=LOOKUP(
    N3:N9,
    TOCOL(
        C3:L13
    ),
    TOCOL(
        B3:B13+C2:L2
    )
)
Excel solution 17 for Normal Distribution!, proposed by Md. Zohurul Islam:
=LET(
    a,
    C2:L2,
    b,
    B3:B13,
    c_,
    a+b,
    d,
    C3:L13,
    e,
    N3:N9,
    x,
    TOCOL(
        d
    ),
    y,
    TOCOL(
        c_
    ),
    XLOOKUP(
        e,
        x,
        y,
        ,
        -1,
        1
    )
)
Excel solution 18 for Normal Distribution!, proposed by Mey Tithveasna:
=XLOOKUP(
    N3:N9,
    TOCOL(
        C3:L13
    ),    TOCOL(
        C2:L2+B3:B13
    ),
    ,
    -1
)
Solving the challenge of Normal Distribution! with Python
Python solution 1 for Normal Distribution!, proposed by Konrad Gryczan, PhD:
import pandas as pd

path = "CH-84 Normal Distribution.xlsx"

input1 = pd.read_excel(path, usecols="B:L", skiprows=1)
input2 = pd.read_excel(path, usecols="N", skiprows=1, nrows=7)
test = pd.read_excel(path, usecols="O", skiprows=1, nrows=7)
test.columns = test.columns.str.replace('.1', '')

result1 = input1.melt(id_vars=["Z"], var_name="Z1", value_name="prob")
result1["Z_tot"] = result1["Z1"] + result1["Z"]
result1 = result1[["Z_tot", "prob"]]

result2 = pd.DataFrame({"Probability": input2["Probability"]})
result2["Z"] = result2["Probability"].apply(lambda x: result1.loc[(result1["prob"] - x).abs().idxmin(), "Z_tot"])

result2["Z"] = result2["Z"].round(2)
test["Z"] = test["Z"].round(2)

print(result2["Z"].equals(test["Z"]))  # True
Solving the challenge of Normal Distribution! with Python in Excel
Python in Excel solution 1 for Normal Distribution!, proposed by Abdallah Ally:
def find_zscore(probability):
 diff = (df1 - probability).abs()
 indices = diff.stack().idxmin()
 return sum(indices)

# Read the data ranges
df1 = xl("B2:L13", headers=True)
df = xl("N2:N9", headers=True)

# Perform data munging
df1 = df1.set_index(keys='Z')
df['Z'] = df['Probability'].map(find_zscore)

# Display the final results
df
Python in Excel solution 2 for Normal Distribution!, proposed by Alejandro Campos:
xl("B2:L13", headers=True)
df = pd.DataFrame(d).set_index("Z")
p = xl("N3:N9")[0]
r = {x: df.index[np.unravel_index(np.abs(df - x).values.argmin(), df.shape)[0]]+df.columns[np.unravel_index(np.abs(df - x).values.argmin(), df.shape)[1]] for x in p}
pd.DataFrame(r.items(), columns=['Probability', 'Z'])
Solving the challenge of Normal Distribution! with R
R solution 1 for Normal Distribution!, proposed by Konrad Gryczan, PhD:
library(tidyverse)
 library(readxl)

 path = "files/CH-84 Normal Distribution.xlsx"
 input1 = read_excel(path, range = "B2:L13")
 input2 = read_excel(path, range = "N2:N9")
 test  = read_excel(path, range = "O2:O9")

 result1 = input1 %>%
 pivot_longer(cols = -c(1), names_to = "Z1", values_to = "prob") %>%
 mutate(Z1 = as.numeric(Z1),
 Z_tot = Z1 + Z) %>%
 select(Z = Z_tot, prob)

 result2 = tibble(Probability = input2$Probability) %>%
 rowwise() %>%
 mutate(Z = result1 %>%
 mutate(diff = abs(prob - Probability)) %>%
 filter(diff == min(diff)) %>%
 pull(Z)) %>%
 ungroup()

 all.equal(result2$Z, test$Z)
 #> [1] TRUE