
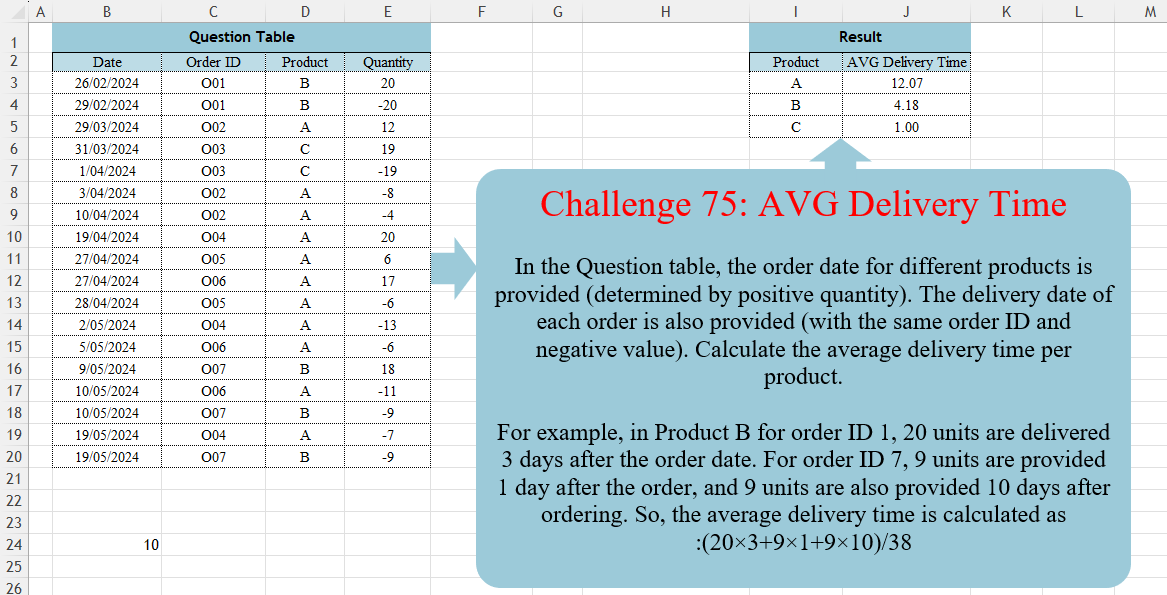
In the Question table, the order date for different products is provided (determined by positive quantity). The delivery date of each order is also provided (with the same order ID and negative value). Calculate the average delivery time per product. For example, in Product B for order ID 1, 20 units are delivered 3 days after the order date. For order ID 7, 9 units are provided 1 day after the order, and 9 units are also provided 10 days after ordering. So, the average delivery time is calculated as :(20×3+9×1+9×10)/38
📌 Challenge Details and Links
Challenge Number: 75
Challenge Difficulty: ⭐⭐⭐
📥Download Sample File
📥Link to the solutions on LinkedIn
Solving the challenge of Avg Delivery Time with Power Query
Power Query solution 1 for Avg Delivery Time, proposed by Zoran Milokanović:
let
  Source = Excel.CurrentWorkbook(){[Name = "Input"]}[Content],
  S = Table.Sort(
    Table.Group(
      Source,
      "Product",
      {
        "AVG Delivery Time",
        each
          let
            T = Table.SelectRows(_, each [Quantity] < 0)
          in
            List.Sum(
              Table.TransformRows(
                T,
                (r) =>
                  Duration.Days(r[Date] - _{List.PositionOf([Order ID], r[Order ID])}[Date])
                    * r[Quantity]
              )
            )
              / List.Sum(T[Quantity])
      }
    ),
    "Product"
  )
in
  S
Power Query solution 2 for Avg Delivery Time, proposed by Alejandro Simón 🇵🇦 🇪🇸:
let
 Source = Excel.CurrentWorkbook(){[Name="Table1"]}[Content],
 Group1 = Table.ExpandListColumn(Table.Group(Source, {"Product", "Order ID"}, {{"All", each
let
a = _,
b = Table.AddIndexColumn(a, "Idx", 0,1),
c = List.Skip(List.Transform(b[Idx], each Duration.Days(b[Date]{_}-b[Date]{0}))),
d ={-b[Quantity]{0}}&List.Transform({0..List.Count(c)-1}, each c{_}*-List.Skip(b[Quantity]){_})
in d}}), "All"),
 Group2 = Table.Group(Group1, {"Product"}, {{"AVG Delivery Time", each
let
a = -List.Sum(List.Select([All], each _<0)),
b = List.Sum(List.Select([All], each _>0))/a
in b}}),
 Sol = Table.Sort(Group2,{{"Product", 0}})
in
 Sol
Power Query solution 3 for Avg Delivery Time, proposed by Alexis Olson:
let
  Source = Excel.CurrentWorkbook(){[Name = "Table1"]}[Content],
  GroupOrder = Table.Group(
    Source,
    {"Order ID", "Product"},
    {
      {
        "Subtable",
        (tbl) =>
          Table.AddColumn(
            tbl,
            "Prod",
            each [Quantity] * Duration.Days(Table.FirstValue(tbl) - [Date])
          )
      }
    }
  ),
  Expand = Table.ExpandTableColumn(GroupOrder, "Subtable", {"Quantity", "Prod"}),
  GroupProduct = Table.Group(
    Expand,
    {"Product"},
    {{"AVG", each List.Sum([Prod]) / List.Sum(List.Select([Quantity], each _ > 0))}}
  )
in
  GroupProduct
Power Query solution 4 for Avg Delivery Time, proposed by Kris Jaganah:
let
  Source = Excel.CurrentWorkbook(){[Name = "Table1"]}[Content],
  Workings = Table.AddColumn(
    Source,
    "AA",
    each
      let
        a = Table.SelectRows(Source, (x) => x[Quantity] > 0 and x[Order ID] = [Order ID])[
          [Date],
          [Quantity]
        ],
        b = Number.From(([Date] - List.First(a[Date])) * - [Quantity]),
        c = b
          / List.Sum(
            Table.SelectRows(Source, (y) => y[Quantity] > 0 and y[Product] = [Product])[Quantity]
          )
      in
        c
  ),
  Group = Table.Group(Workings, {"Product"}, {"AVG Delivery Time", each List.Sum([AA])}),
  Sort = Table.Sort(Group, {"Product", 0})
in
  Sort
Power Query solution 5 for Avg Delivery Time, proposed by Nelson Mwangi:
let
  Source = Excel.CurrentWorkbook(){[Name = "Table1"]}[Content],
  GroupByOrder = Table.Group(
    Source,
    {"Order ID"},
    {
      "Data",
      each
        let
          Orderdate = List.Min([Date]),
          Filter    = Table.SelectRows(_, each [Quantity] < 1),
          Days      = Table.AddColumn(Filter, "Days", each Duration.Days([Date] - Orderdate)),
          Total     = Table.AddColumn(Days, "Total", each Number.Abs([Quantity] * [Days])),
          Columns   = Table.SelectColumns(Total, {"Product", "Quantity", "Total"})
        in
          Columns,
      type table
    }
  )[Data],
  Combine = Table.Combine(GroupByOrder),
  GroupByProduct = Table.Group(
    Combine,
    {"Product"},
    {
      {"Total", each List.Sum([Total]), type number},
      {"Qty", each List.Sum([Quantity]), type number}
    }
  ),
  Result = Table.AddColumn(GroupByProduct, "AVG Delivery Time", each [Total] / Number.Abs([Qty]))[
    [Product],
    [AVG Delivery Time]
  ],
  Sort = Table.Sort(Result, {{"Product", Order.Ascending}})
in
  Sort
Power Query solution 6 for Avg Delivery Time, proposed by Yaroslav Drohomyretskyi:
let
  Source = Excel.CurrentWorkbook(){[Name = "Table1"]}[Content],
  Orders = Table.SelectRows(Source, each [Quantity] > 0),
  Delivery = Table.ExpandTableColumn(
    Table.NestedJoin(
      Orders,
      {"Order ID"},
      Table.SelectRows(Source, each [Quantity] < 0),
      {"Order ID"},
      "Delivery",
      JoinKind.LeftOuter
    ),
    "Delivery",
    {"Date", "Quantity"},
    {"Delivery.Date", "Delivery.Quantity"}
  ),
  Calc = Table.AddColumn(
    Delivery,
    "Custom",
    each ([Delivery.Date] - [Date]) * - [Delivery.Quantity]
  ),
  Group = Table.TransformColumnTypes(
    Table.Sort(
      Table.Group(
        Calc,
        {"Product"},
        {
          {
            "AVG Delivery Time",
            each List.Sum([Custom]) / - List.Sum([Delivery.Quantity]),
            type nullable number
          }
        }
      ),
      {{"Product", Order.Ascending}}
    ),
    {{"AVG Delivery Time", type number}}
  )
in
  Group
Power Query solution 7 for Avg Delivery Time, proposed by 🇮🇷 Navid Esmaeilzadeh اسماعیل زاده:
let
  S = Excel.CurrentWorkbook(){[Name = "Table1"]}[Content],
  B = Table.Group(
    S,
    {"Order ID", "Product"},
    {
      {
        "Tbl",
        each _,
        type table [
          Date = nullable date,
          Order ID = nullable text,
          Product = nullable text,
          Quantity = nullable number
        ]
      }
    }
  ),
  C = Table.AddColumn(B, "TQ", each List.Max([Tbl][Quantity])),
  MF = (Tb) =>
    let
      B1 = Table.AddIndexColumn(Tb, "I", 0, 1, Int64.Type),
      B2 = Table.AddColumn(
        B1,
        "T",
        each
          if Duration.TotalDays([Date] - B1[Date]{0}) * Number.Abs([Quantity]) = 0 then
            null
          else
            Duration.TotalDays([Date] - B1[Date]{0}) * Number.Abs([Quantity])
      ),
      B3 = Table.Group(B2, {"Product"}, {{"T", each List.Sum([T]), type nullable number}})
    in
      B3,
  D = Table.AddColumn(C, "MF", each MF([Tbl])),
  E = Table.ExpandTableColumn(D, "MF", {"T"}, {"T"}),
  F = Table.Group(
    E,
    {"Product"},
    {{"TQ", each List.Sum([TQ]), type number}, {"T", each List.Sum([T]), type number}}
  ),
  G = Table.AddColumn(F, "AVG Dellivery Time", each [T] / [TQ], type number),
  H = Table.Sort(G, {{"Product", Order.Ascending}}),
  I = Table.SelectColumns(H, {"Product", "AVG Dellivery Time"})
in
  I
Power Query solution 8 for Avg Delivery Time, proposed by Peter Tholstrup:
let
  Source = Excel.CurrentWorkbook(){[Name = "Table1"]}[Content],
  transform = (t) =>
    [
      f = (t, n) => Table.SelectRows(t, each Number.Sign([Quantity]) = n),
      d = List.Transform(f(t, - 1)[Date], each Number.From(_) - Number.From(f(t, 1)[Date]{0})),
      q = List.Transform(f(t, - 1)[Quantity], each - _),
      r = List.Transform(
        List.Zip({d, q}),
        each [Product = t[Product]{0}, Weight = List.Product(_), Qty = _{1}]
      ),
      result = Table.FromRecords(r)
    ][result],
  weight = Table.Combine(Table.Group(Source, {"Order ID", "Product"}, {"temp", transform})[temp]),
  average = Table.Group(
    weight,
    {"Product"},
    {"AVG Delivery Time", each List.Sum([Weight]) / List.Sum([Qty])}
  ),
  sort = Table.Sort(average, {"Product"})
in
  sort
Solving the challenge of Avg Delivery Time with Excel
Excel solution 1 for Avg Delivery Time, proposed by Bo Rydobon 🇹🇭:
=LET(d,
    B3:B20,
    o,
    C3:C20,
    p,
    D3:D20,
    n,
    E3:E20,
    GROUPBY(p,
    (d-MINIFS(
        d,
        o,
        o
    ))*n/SUMIFS(
        n,
        n,
        "<0",
        p,
        p
    ),
    SUM,
    ,
    0))
Excel solution 2 for Avg Delivery Time, proposed by محمد حلمي:
=LET(b,
    B3:B20,
    d,
    D3:D20,
    e,
    E3:E20,
    c,
    C3:C20,
    i,
    SORT(
        UNIQUE(
            d
        )
    ),
    HSTACK(i,MAP(i,
    LAMBDA(a,
    LET(r,
    (d=a)*(e<0)*e,
    SUM(r*(b-XLOOKUP(
        c,
        c,
        b
    ))/SUM(
        r
    )))))))
Excel solution 3 for Avg Delivery Time, proposed by Oscar Mendez Roca Farell:
=LET(p,
     D3:D20,
     u,
     SORT(
         UNIQUE(
             p
         )
     ),
     HSTACK(VSTACK(
         D2,
          u
     ),
     REDUCE(J2,
     u,
     LAMBDA(i,
     x,
     LET(m,
     FILTER(
         B3:E20,
          p=x
     ),
     F,
     LAMBDA(
         j,
          INDEX(
              m,
               ,
               j
          )
     ),
     q,
     F(
         4
     ),
     VSTACK(i,
     SUM(MAP(UNIQUE(
         F(
             2
         )
     ),
     LAMBDA(a,
     LET(n,
     FILTER(
         HSTACK(
             F(
                 1
             ),
              q
         ),
          F(
             2
         )=a
     ),
     SUM((@n-DROP(
         n,
          1,
         -1
     ))*DROP(
         n,
          1,
          1
     ))))))/SUM(q*(q>0))))))))
Excel solution 4 for Avg Delivery Time, proposed by Julian Poeltl:
=LET(T,
    B3:E20,
    P,
    CHOOSECOLS(
        T,
        3
    ),
    UP,
    SORT(
        UNIQUE(
            P
        )
    ),
    OI,
    CHOOSECOLS(
        T,
        2
    ),
    UOI,
    UNIQUE(
        OI
    ),
    Q,
    TAKE(
        T,
        ,
        -1
    ),
    BUOI,
    MAP(UOI,
    LAMBDA(A,
    LET(F,
    FILTER(
        T,
        OI=A
    ),
    SUM((INDEX(
        F,
        1,
        1
    )-INDEX(
        F,
        SEQUENCE(
            ROWS(
                F
            )-1,
            ,
            2
        ),
        1
    ))*INDEX(
        F,
        SEQUENCE(
            ROWS(
                F
            )-1,
            ,
            2
        ),
        4
    ))/INDEX(
        F,
        1,
        4
    )))),
    X,
    XLOOKUP(
        UOI,
        OI,
        Q
    ),
    VSTACK(HSTACK(
        "Product",
        "AVG Delivery Time"
    ),
    HSTACK(UP,
    MAP(UP,
    LAMBDA(A,
    SUM(
        FILTER(
            BUOI*X,
            XLOOKUP(
                UOI,
                OI,
                P
            )=A
        )
    )/SUM(FILTER(Q,
    (Q>0)*(P=A))))))))
Excel solution 5 for Avg Delivery Time, proposed by Kris Jaganah:
=LET(a,
    B3:B20,
    b,
    C3:C20,
    c,
    D3:D20,
    d,
    E3:E20,
    e,
    ((a-XLOOKUP(
        b,
        b,
        d
    ))*-d)/MAP(c,
    LAMBDA(x,
    SUM((d>0)*(c=x)*d))),
    GROUPBY(
        c,
        e,
        SUM,
        ,
        0
    ))
Excel solution 6 for Avg Delivery Time, proposed by Kris Jaganah:
=LET(a,
    B3:B20,
    c,
    D3:D20,
    d,
    E3:E20,
    GROUPBY(c,
    (a-XLOOKUP(
        c,
        c,
        a
    ))*-d/SUMIFS(
        d,
        c,
        c,
        d,
        ">0"
    ),
    SUM,
    ,
    0))
Excel solution 7 for Avg Delivery Time, proposed by Imam Hambali:
=LET(
    dt,
     B3:B20,    order,
     C3:C20,    prd,
     D3:D20,    qty,
    E3:E20,    mindate,
     MINIFS(
         dt,
         order,
         order
     ),    qdate,
     DATEDIF(
         mindate,
          dt,
         "D"
     )*qty*-1,    grouping,
     GROUPBY(
         prd,
          HSTACK(
              qty,
              qdate
          ),
         LAMBDA(
             x,
             SUM(
                 IF(
                     x>0,
                     x,
                     0
                 )
             )
         ),
         0,
         0
     ),    final,
     VSTACK(
         {"Product",
         "AVG Delivery Time"},
         HSTACK(
             CHOOSECOLS(
                 grouping,
                 1
             ),
              ROUND(
                  CHOOSECOLS(
                      grouping,
                      -1
                  )/CHOOSECOLS(
                      grouping,
                      2
                  ),
                  2
              )
         )
     ),    final)
Excel solution 8 for Avg Delivery Time, proposed by Sunny Baggu:
=LET(     _p,
     SORT(
         UNIQUE(
             D3:D20
         )
     ),     HSTACK(          _p,          MAP(

               _p,

               LAMBDA(
                   x,

                    LET(

                         _f,
                         CHOOSECOLS(
                             FILTER(
                                 B3:E20,
                                  D3:D20 = x
                             ),
                              1,
                              2,
                              4
                         ),

                         _c1,
                         CHOOSECOLS(
                             _f,
                              1
                         ),

                         _c2,
                         CHOOSECOLS(
                             _f,
                              2
                         ),

                         _c3,
                         CHOOSECOLS(
                             _f,
                              3
                         ),

                         _u,
                         UNIQUE(
                             _c2
                         ),

                         SUM(

                              MAP(

                                   _u,

                                   LAMBDA(
                                       a,

                                        LET(

                                             _a,
                                             FILTER(
                                                 _c1,
                                                  _c2 = a
                                             ),

                                             _b,
                                             DROP(
                                                 _a,
                                                  1
                                             ) - TAKE(
                                                 _a,
                                                  1
                                             ),

                                             _c,
                                             DROP(
                                                 FILTER(
                                                     _c3,
                                                      _c2 = a
                                                 ),
                                                  1
                                             ),

                                             SUM(
                                                 _b * _c
                                             )

                                        )

                                   )

                              )

                         ) / SUM(
                             FILTER(
                                 _c3,
                                  _c3 < 0
                             )
                         )

                    )

               )

          )     ))
Excel solution 9 for Avg Delivery Time, proposed by Bilal Mahmoud kh.:
=SORT(HSTACK(UNIQUE(
    D3:D20
),
    MAP(UNIQUE(
    D3:D20
),
    LAMBDA(x,
    LET(a,
    FILTER(
        C3:C20,
        D3:D20=x
    ),
    b,
    SUM(
        MAP(
            UNIQUE(
                a
            ),
            LAMBDA(
                y,
                LET(
                    n,
                    FILTER(
                        B3:B20,
                        C3:C20=y
                    ),
                    m,
                    FILTER(
                        E3:E20,
                        C3:C20=y
                    ),
                    SUM(
                        ABS(
                            INDEX(
                                m,
                                SEQUENCE(
                                    COUNTA(
                                        m
                                    )-1,
                                    ,
                                    2,
                                    1
                                ),
                                1
                            )
                        )*DATEDIF(
                            INDEX(
                                n,
                                1,
                                1
                            ),
                            INDEX(
                                n,
                                SEQUENCE(
                                    COUNTA(
                                        m
                                    )-1,
                                    ,
                                    2,
                                    1
                                ),
                                1
                            ),
                            "d"
                        )
                    )
                )
            )
        )
    )/SUM(ABS(FILTER(E3:E20,
    (D3:D20=x)*(E3:E20 < 0)))),
    ROUND(
        b,
        2
    ))))))
Excel solution 10 for Avg Delivery Time, proposed by Erik Oehm:
=LET(
 _Input,
     B3:E20, _Products,
     SORT(
         UNIQUE(
             CHOOSECOLS(
                 _Input,
                  3
             )
         ),
          1
     ), fnAvgDeliveryTimes,
     LAMBDA(product,
     LET(
 _ProductData,
     FILTER(
         _Input,
          INDEX(
              _Input,
               ,
               3
          ) = product
     ), _Dates,
     INDEX(
         _ProductData,
          ,
          1
     ), _Quantities,
     INDEX(
         _ProductData,
          ,
          4
     ), _Cumm,
     SCAN(
         0,
          _Quantities,
          LAMBDA(
              s,
              a,
               s + a
          )
     ), _Chg,
     _Dates - VSTACK(
         0,
          DROP(
              _Dates,
               -1
          )
     ), _Resets,
     IF(
         _Quantities = _Cumm,
          NA(),
          _Chg
     ), _Days,
     SCAN(
         0,
          _Resets,
          LAMBDA(
              s,
              x,
               IF(
                   ISNA(
                       x
                   ),
                    0,
                    s + x
               )
          )
     ), _QtyDelivered,
     SUM(-_Quantities * (_Quantities < 0)), _Average,
     SUM(
         -_Quantities * _Days
     ) / _QtyDelivered, _Average
 )), _Result,
     HSTACK(
         _Products,
          MAP(
              _Products,
               fnAvgDeliveryTimes
          )
     ), _Result
)
Solving the challenge of Avg Delivery Time with Python
Python solution 1 for Avg Delivery Time, proposed by Konrad Gryczan, PhD:
import pandas as pd

path = "CH-75 Table Transformation.xlsx"
input = pd.read_excel(path, usecols="B:E", skiprows=1, nrows=18)
test = pd.read_excel(path, usecols="I:J", skiprows=1, nrows=3)
test["AVG Delivery Time"] = round(test["AVG Delivery Time"], 2)

orders = input[input["Quantity"] > 0].reset_index(drop=True)
deliveries = input[input["Quantity"] < 0].reset_index(drop=True)

together = pd.merge(orders, deliveries, on="Order ID", how="left")
together["Date_y"] = pd.to_datetime(together["Date_y"])
together["Date_x"] = pd.to_datetime(together["Date_x"])
together["Days"] = (together["Date_y"] - together["Date_x"]).dt.days.astype(int)
together["total_quantity"] = together.groupby("Product_x")["Quantity_y"].transform("sum").multiply(-1)

together["avg_delivery_time"] = (together["Days"] * together["Quantity_y"] * -1) / together["total_quantity"]
together = together.groupby("Product_x")["avg_delivery_time"].sum().round(2).reset_index()
together.columns = test.columns

print(together.equals(test)) # True
Solving the challenge of Avg Delivery Time with R
R solution 1 for Avg Delivery Time, proposed by Konrad Gryczan, PhD:
library(tidyverse)
library(readxl)

path = "files/CH-75 Table Transformation.xlsx"
input = read_xlsx(path, range = "B2:E20")
test = read_xlsx(path, range = "I2:J5") %>%
 mutate(`AVG Delivery Time` = round(`AVG Delivery Time`, 2))

orders = input %>%
 filter(Quantity > 0)
deliveries = input %>%
 filter(Quantity < 0)

together = orders %>%
 left_join(deliveries, by = c("Order ID" = "Order ID")) %>%
 mutate(Days = as.numeric(Date.y - Date.x)) %>%
 mutate(total_quantity = -sum(Quantity.y), .by = Product.x) %>%
 summarise(`AVG Delivery Time` = round(sum(Days * -Quantity.y) / min(total_quantity),2),
 .by = Product.x) %>%
 arrange(Product.x) %>%
 rename(Product = Product.x)

identical(together, test)
# [1] TRUE
Solving the challenge of Avg Delivery Time with DAX
DAX solution 1 for Avg Delivery Time, proposed by Zoran Milokanović:
=EVALUATE
SUMMARIZECOLUMNS(
 Input[Product],
 "AVG Delivery Date",
 VAR TotalQuantity = CALCULATE(SUM(Input[Quantity]), Input[Quantity] > 0)
 VAR TotalDeliveryTime = SUMX(ADDCOLUMNS(Input, "Delivery Time", VALUE(CALCULATE(MAX(Input[Date]), ALLEXCEPT(Input, Input[Order ID], Input[Product]), Input[Quantity] > 0) - Input[Date]) * Input[Quantity]), [Delivery Time])
 RETURN
 DIVIDE(TotalDeliveryTime, TotalQuantity)
)
ORDER BY
 Input[Product]
Solving the challenge of Avg Delivery Time with SQL
SQL solution 1 for Avg Delivery Time, proposed by Zoran Milokanović:
Avg Delivery Time w/
hashtag
#dax.
hashtag
#bitanbit
hashtag
#powerbi

EVALUATE
SELECTCOLUMNS(
 GROUPBY(
 FILTER(
 ADDCOLUMNS(Input, "Delivery Time",
 VAR OrderDate = SELECTCOLUMNS(INDEX(1, ORDERBY(Input[Date]), PARTITIONBY(Input[Order ID])), Input[Date])
 RETURN
 VALUE(Input[Date] - OrderDate)
 ),
 Input[Quantity] < 0
 ),
 Input[Product],
 "Total Delivery Time", SUMX(CURRENTGROUP(), Input[Quantity] * [Delivery Time]),
 "Total Quantity", SUMX(CURRENTGROUP(), Input[Quantity])
 ),
 Input[Product],
 "AVG Delivery Date",
 DIVIDE([Total Delivery Time], [Total Quantity])
)
ORDER BY
 Input[Product]