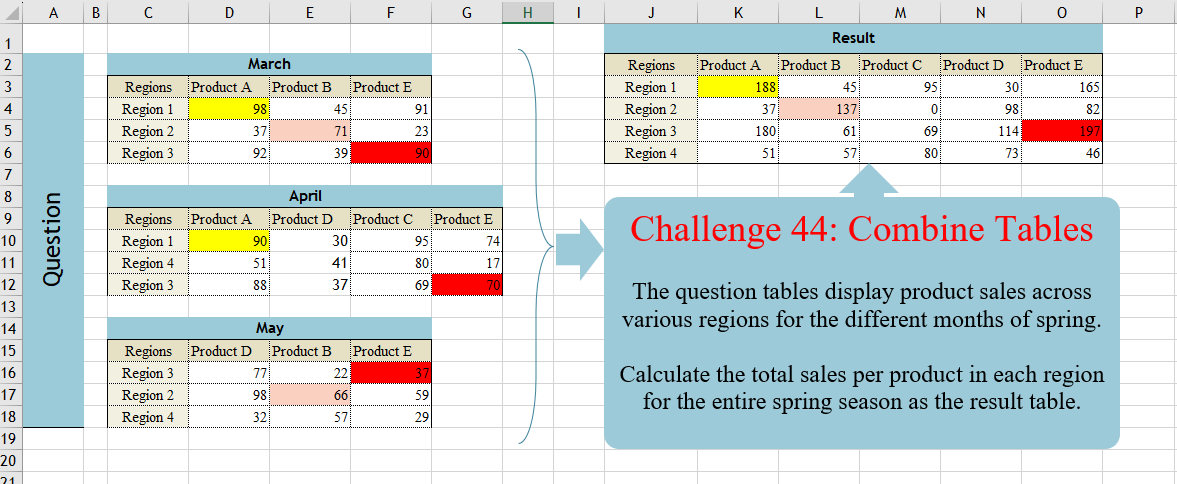
The question tables display product sales across various regions for the different months of spring. Calculate the total sales per product in each region for the entire spring season as the result table.
📌 Challenge Details and Links
Challenge Number: 44
Challenge Difficulty: ⭐⭐⭐
📥Download Sample File
📥Link to the solutions on LinkedIn
📥Link to the solution on YouTube
Solving the challenge of Combine Tables with Power Query
Power Query solution 1 for Combine Tables, proposed by Brian Julius:
let

Source = Table.Combine(  {  Table.PromoteHeaders( Excel.CurrentWorkbook(){[Name="March"]}[Content]),
 Excel.CurrentWorkbook(){[Name="Table1"]}[Content],
 Excel.CurrentWorkbook(){[Name="May"]}[Content] }),

 UnpivOther = Table.Sort( Table.UnpivotOtherColumns(Source, {"Regions"}, "Product", "Sales"), {{"Regions", Order.Ascending}, {"Product", Order.Ascending}}),

PivotSum = Table.Pivot(UnpivOther, List.Distinct(UnpivOther[Product]), "Product", "Sales", List.Sum)

in
 PivotSum
Power Query solution 2 for Combine Tables, proposed by Luan Rodrigues:
let
  Fonte = Table.Combine(Excel.CurrentWorkbook()[Content]),
  gp = Table.Group(
    Fonte,
    {"Regions"},
    {
      {
        "tab",
        each
          let
            a = List.RemoveFirstN(Table.ColumnNames(_)),
            b = Table.FromRows({List.Transform(List.RemoveFirstN(Table.ToColumns(_)), List.Sum)}, a)
          in
            Table.SelectColumns(b, List.Sort(a))
      }
    }
  ),
  res = Table.ExpandTableColumn(gp, "tab", Table.ColumnNames(gp[tab]{0}))
in
  res
Power Query solution 3 for Combine Tables, proposed by Ramiro Ayala Chávez:
let
t3 = Excel.CurrentWorkbook(){[Name="Table3"]}[Content],
t4 = Excel.CurrentWorkbook(){[Name="Table4"]}[Content],
t5 = Excel.CurrentWorkbook(){[Name="Table5"]}[Content],
S = List.Sum,
a = Table.ReplaceValue(t3&t4&t5,null,0,Replacer.ReplaceValue,{"Product A","Product B","Product E","Product D","Product C"}),
b = Table.Group(a,{"Regions"},{{"A", each S([Product A])},{"B", each S([Product B])},{"C", each S([Product C])},{"D", each S([Product D])},{"E", each S([Product E])}}),
Sol = Table.RenameColumns(Table.TransformColumnNames(b, each "Product "&_),{"Product Regions","Regions"})
in
Sol
Power Query solution 4 for Combine Tables, proposed by Aditya Kumar Darak 🇮🇳:
let

 // dSalesMar = C3:D6, dSalesApr = C9:G12, dSalesMay = C15:F18
 Source = Excel.CurrentWorkbook(),
 Select = Table.SelectRows ( Source, each Text.Start ( [Name], 6 ) = "dSales" ),
 Combine = Table.Combine ( Select[Content] ),
 Unpivot = Table.UnpivotOtherColumns ( Combine, { "Regions" }, "Product", "Sales" ),
 Return = Table.Pivot (
 Unpivot,
 List.Sort ( List.Distinct ( Unpivot[Product] ) ),
 "Product",
 "Sales",
 List.Sum
 )
in
 Return
Power Query solution 5 for Combine Tables, proposed by Alejandro Simón 🇵🇦 🇪🇸:
let
Source = Table.Combine(Excel.CurrentWorkbook()[Content]),
Group = Table.Group(Source, {"Regions"}, {{"A", each let
a = List.Transform(List.Skip(Table.ToColumns(_)), each List.Sum(_)??0),
b = Table.FromRows({a}, List.Skip(Table.ColumnNames(_)))
in b}}),
Exp = Table.ExpandTableColumn(Group, "A", List.Skip(Table.ColumnNames(Source))),
Cols = Table.ColumnNames(Exp),
Sol = Table.ReorderColumns(Exp, {Cols{0}}&List.Sort(List.Skip(Cols), each Text.End(_,1)))
in
Sol
Power Query solution 6 for Combine Tables, proposed by Kris Jaganah:
let
  Source = Excel.CurrentWorkbook(){[Name = "Table1"]}[Content],
  Month = Table.AddColumn(Source, "Month", each if [Column2] = null then [Column1] else null),
  Fill = Table.FillDown(Month, {"Month"}),
  Unpivot = Table.UnpivotOtherColumns(Fill, {"Column1", "Month"}, "Attribute", "Value"),
  Col = Table.AddColumn(Unpivot, "Custom", each if [Column1] = "Regions" then [Attribute] else null),
  Merge = Table.NestedJoin(
    Col,
    {"Month", "Attribute"},
    Col,
    {"Month", "Custom"},
    "Col",
    JoinKind.LeftOuter
  ),
  Xpand = Table.ExpandTableColumn(Merge, "Col", {"Value"}, {"Product"}),
  Filter1 = Table.SelectRows(Xpand, each ([Custom] = null)),
  Select = Table.SelectColumns(Filter1, {"Column1", "Value", "Product"}),
  Rename = Table.RenameColumns(Select, {{"Column1", "Regions"}}),
  Sort = Table.Sort(Rename, {"Product", 0}),
  Pivot = Table.Pivot(Sort, List.Distinct(Sort[Product]), "Product", "Value", List.Sum)
in
  Pivot
Power Query solution 7 for Combine Tables, proposed by Nelson Mwangi:
let
  Source = Excel.CurrentWorkbook(),
  AllColNames = Table.ColumnNames(Table.Combine(Table.SelectColumns(Source, "Content")[Content])),
  Expand = Table.ExpandTableColumn(Table.SelectColumns(Source, "Content"), "Content", AllColNames),
  Unpivot = Table.UnpivotOtherColumns(Expand, {"Regions"}, "A", "V"),
  Group = Table.Group(Unpivot, {"Regions", "A"}, {{"Count", each List.Sum([V]), type number}}),
  Sort = Table.Sort(Group, {{"A", Order.Ascending}}),
  Pivot = Table.Pivot(Sort, List.Distinct(Sort[A]), "A", "Count", List.Sum)
in
  Pivot
Power Query solution 8 for Combine Tables, proposed by Mahmoud Bani Asadi:
let
 //named range C2:G18 = data
 Source = Excel.CurrentWorkbook(){[Name="data"]}[Content],
 Group = Table.Combine(Table.Group(Source, {"Column1"}, {{"tbl", each Table.UnpivotOtherColumns(Table.PromoteHeaders(_),{"Regions"}, "Attribute", "Value")}},0,(x,y)=>Number.From(y[Column1]="Regions"))[tbl]),
 Pivot = Table.Pivot(Group, List.Sort(List.Distinct(Group[Attribute])), "Attribute", "Value", List.Sum)
in
 Pivot
Power Query solution 9 for Combine Tables, proposed by 🇮🇷 Navid Esmaeilzadeh اسماعیل زاده:
let
  S1  = Excel.CurrentWorkbook(){[Name = "T_1"]}[Content],
  S2  = Excel.CurrentWorkbook(){[Name = "T_2"]}[Content],
  S3  = Excel.CurrentWorkbook(){[Name = "T_3"]}[Content],
  A   = Table.Combine({S1, S2, S3}),
  B   = Table.UnpivotOtherColumns(A, {"Regions"}, "Attribute", "Value"),
  C   = Table.Group(B, {"Regions", "Attribute"}, {{"Value", each List.Sum([Value]), type number}}),
  Sol = Table.Pivot(C, List.Sort(List.Distinct(C[Attribute])), "Attribute", "Value", List.Sum)
in
  Sol
Solving the challenge of Combine Tables with Excel
Excel solution 1 for Combine Tables, proposed by Bo Rydobon 🇹🇭:
=LET(
    l,
    LAMBDA(
        x,
        SCAN(
            ,
            C3:C27,
            LAMBDA(
                a,
                v,
                IF(
                    v>x,
                    v,
                    a
                )
            )
        )
    ),
    SORT(
        FILTER(
            HSTACK(
                l(
                    0
                ),
                l(
                    "a"
                ),
                D3:E27
            ),
            E3:E27
        )
    )
)
Excel solution 2 for Combine Tables, proposed by محمد حلمي:
=LET(    u,
    UNIQUE(
        C3:C18
    ),
    y,
    SORT(
        UNIQUE(
            TOROW(
                D3:G18,
                1
            ),
            1
        ),
        ,
        ,
        1
    ),    j,
    FILTER(
        y,
        IFERROR(
            y^0-1,
            1
        )
    ),    x,
    FILTER(
        u,
        ISNUMBER(
            -RIGHT(
                u
            )
        )
    ),
    VSTACK(
        HSTACK(
            C3,
            j
        ),
        HSTACK(
            x,

            REDUCE(
                0,
                SEQUENCE(
                    3
                ),
                LAMBDA(
                    a,
                    v,
                    LET(
                        i,
                        CHOOSE(
                            v,
                            C3:F6,
                            C9:G12,
                            C15:F18
                        ),
                        a+XLOOKUP(
                            x&j,
                            TOCOL(
                                DROP(
                                    TAKE(
                                        i,
                                        ,
                                        1
                                    ),
                                    1
                                )&DROP(
                                    TAKE(
                                        i,
                                        1
                                    ),
                                    ,
                                    1
                                )
                            ),
                            TOCOL(
                                DROP(
                                    i,
                                    1,
                                    1
                                )
                            ),
                            0
                        )
                    )
                )
            )
        )
    )
)
Excel solution 3 for Combine Tables, proposed by 🇵🇪 Ned Navarrete C.:
=LET(e,
    LAMBDA(
        m,
        LET(
            c,
            COLUMNS(
                m
            ),
            f,
            ROWS(
                m
            ),
            TEXTSPLIT(
                CONCAT(
                    DROP(
                        m,
                        1,
                        1-c
                    )&"*"&DROP(
                        m,
                        1-f,
                        1
                    )&"*"&DROP(
                        m,
                        1,
                        1
                    )&"|"
                ),
                "*",
                "|",
                1
            )
        )
    ),
    i,
    LAMBDA(
        c,
        INDEX(
            VSTACK(
                e(
                    C3:F6
                ),
                e(
                    C9:G12
                ),
                e(
                    C15:F18
                )
            ),
            ,
            c
        )
    ),
    a,
    UNIQUE(
        i(
            1
        )
    ),
    b,
    TOROW(
        SORT(
            UNIQUE(
                i(
                    2
                )
            )
        )
    ),
    VSTACK(HSTACK(
        "Regions",
        b
    ),
    HSTACK(a,
    WRAPROWS(MAP(TOCOL(
        a&b
    ),
    LAMBDA(p,
    SUM(i(
        3
    )*(i(
            1
        )&i(
                    2
                )=p)))),
    COUNTA(
        b
    )))))
Excel solution 4 for Combine Tables, proposed by Oscar Mendez Roca Farell:
=LET(
    A,
     C3:F6,
     B,
     C9:G12,
     C,
     C15:F18,
     R,
     DROP(
         UNIQUE(
             TAKE(
                 VSTACK(
                     A,
                     B,
                     C
                 ),
                 ,
                 1
             )
         ),
         1
     ),
     P,
     DROP(
         UNIQUE(
             TAKE(
                 HSTACK(
                     A,
                     B,
                     C
                 ),
                 1
             ),
             1
         ),
         ,
         1
     ),
     F,
     LAMBDA(
         i,
          XLOOKUP(
              R&SORTBY(
                  P,
                  RIGHT(
                      P
                  )
              ),
               TOCOL(
                   DROP(
                       TAKE(
                           i,
                           ,
                           1
                       ),
                       1
                   )&DROP(
                       TAKE(
                           i,
                           1
                       ),
                       ,
                       1
                   )
               ),
               TOCOL(
                   IFS(
                       i,
                        i
                   ),
                    2
               ),
               0
          )
     ),
     VSTACK(
         HSTACK(
             C3,
             SORTBY(
                  P,
                  RIGHT(
                      P
                  )
              )
         ),
          HSTACK(
              R,
               F(
                   A
               )+F(
                   B
               )+F(
                   C
               )
          )
     )
)
Excel solution 5 for Combine Tables, proposed by Julian Poeltl:
=LET(
    F,
    LAMBDA(
        T,
        L_Flattena2DTableintoColumns(
            T
        )
    ),
    T,
    VSTACK(
        F(
            C3:F6
        ),
        F(
            C9:G12
        ),
        F(
            C15:F18
        )
    ),
    R,
    TAKE(
        T,
        ,
        1
    ),
    P,
    CHOOSECOLS(
        T,
        2
    ),
    S,
    TAKE(
        T,
        ,
        -1
    ),
    UR,
    UNIQUE(
        R
    ),
    UP,
    TRANSPOSE(
        SORT(
            UNIQUE(
                P
            )
        )
    ),
    Su,
    WRAPROWS(
        IFERROR(
            MAP(
                TOROW(
                    UR&UP
                ),
                LAMBDA(
                    A,
                    SUM(
                        FILTER(
                            S,
                            R&P=A
                        )
                    )
                )
            ),
            0
        ),
        COUNTA(
            UP
        )
    ),
    VSTACK(
        HSTACK(
            "Regions",
            UP
        ),
        HSTACK(
            UR,
            Su
        )
    )
)

Pre-programmed Lambdas:
L_Flattena2DTableintoColumns:
=LAMBDA(Table,
    LET(ROWS,
    ROWS(
        DROP(
            Table,
            1,
            1
        )
    ),
    COLUMNS,
    COLUMNS(
        DROP(
            Table,
            1,
            1
        )
    ),
    HRows,
    CHOOSEROWS(TAKE(
        Table,
        -ROWS,
        1
    ),
    (ROUNDDOWN(
        SEQUENCE(
            ROWS*COLUMNS,
            ,
            0
        )/COLUMNS,
        0
    )+1)),
    HColumn,
    CHOOSEROWS(
        TOROW(
            TAKE(
                Table,
                1,
                -COLUMNS
            )
        ),
        L_RepeatingNumberSequence(
            COLUMNS,
            ROWS
        )
    ),
    Data,
    TOCOL(
        DROP(
            Table,
            1,
            1
        )
    ),
    HSTACK(
        HRows,
        HColumn,
        Data
    )))

L_RepeatingNumberSequence:
=LAMBDA(
    Numbers,
    Repetitions,
    IF(
        MOD(
            SEQUENCE(
                Numbers*Repetitions
            ),
            Numbers
        )=0,
        Numbers,
        MOD(
            SEQUENCE(
                Repetitions*Numbers
            ),
            Numbers
        )
    )
)
Excel solution 6 for Combine Tables, proposed by John Jairo Vergara Domínguez:
=LET(
    f,
    LAMBDA(
        r,
        MID(
            TOCOL(
                IFS(
                    r,
                    TAKE(
                        r,
                        ,
                        1
                    )&TAKE(
                        r,
                        1
                    )&r
                ),
                2
            ),
            {1,
            9,
            18},
            {8,
            9,
            2}
        )
    ),
    i,
    VSTACK(
        f(
            C3:F6
        ),
        f(
            C9:G12
        ),
        f(
            C15:F18
        )
    ),
    PIVOTBY(
        TAKE(
            i,
            ,
            1
        ),
        INDEX(
            i,
            ,
            2
        ),
        --DROP(
            i,
            ,
            2
        ),
        SUM,
        ,
        0,
        ,
        0
    )
)
Excel solution 7 for Combine Tables, proposed by Mahmoud Bani Asadi:
=LET(    unpivot,
    LAMBDA(
        tbl,        LET(

            col,
            DROP(
                TAKE(
                    tbl,
                    ,
                    1
                ),
                1
            ),

            row,
            DROP(
                TAKE(
                    tbl,
                    1
                ),
                ,
                1
            ),

            data,
            DROP(
                tbl,
                1,
                1
            ),

            HSTACK(
                TOCOL(
                    IFNA(
                        col,
                        row
                    )
                ),
                TOCOL(
                    IFNA(
                        row,
                        col
                    )
                ),
                TOCOL(
                    data
                )
            )
        )
    ),    merge,
    VSTACK(
        unpivot(
            C3:F6
        ),
        unpivot(
            C9:G12
        ),
        unpivot(
            C15:F18
        )
    ),    PIVOTBY(
        TAKE(
            merge,
            ,
            1
        ),
        CHOOSECOLS(
            merge,
            2
        ),
        TAKE(
            merge,
            ,
            -1
        ),
        SUM,
        ,
        0,
        ,
        0
    )
)
Excel solution 8 for Combine Tables, proposed by Sunny Baggu:
=LET(     _r,
     UNIQUE(
         VSTACK(
             C4:C6,
              C10:C12,
              C16:C18
         )
     ),     _p,
     SORT(
         UNIQUE(
             HSTACK(
                 D3:F3,
                  D9:G9,
                  D15:F15
             ),
              1
         ),
          ,
          ,
          1
     ),     _tbl,
     IF(
         SEARCH(
             "Region ",
              C3:C18
         ),
          C3:C18,
          x
     ) &
     IF(          D3:G18,          TRANSPOSE(

               SCAN(
                   "",
                    TRANSPOSE(
                        D3:G18
                    ),
                    LAMBDA(
                        a,
                         v,
                         IF(
                             AND(
                                 v <> "",
                                  ISTEXT(
                                      v
                                  )
                             ),
                              v,
                              a
                         )
                    )
               )

          ),          x     ),     _v,
     IF(
         ISTEXT(
             _tbl
         ),
          D3:G18,
          x
     ),     _res,
     IFERROR(
         MAP(
             _r & _p,
              LAMBDA(
                  a,
                   SUM(
                       TOCOL(
                           IF(
                               _tbl = a,
                                _v,
                                x
                           ),
                            3
                       )
                   )
              )
         ),
          0
     ),     VSTACK(
         HSTACK(
             C3,
              _p
         ),
          HSTACK(
              _r,
               _res
          )
     ))
Excel solution 9 for Combine Tables, proposed by Sunny Baggu:
=LET(     rng,
     C3:G18,     _c,
     TAKE(
         rng,
          ,
          1
     ),     _d,
     DROP(
         rng,
          ,
          1
     ),     _r,
     SORT(
         UNIQUE(
             FILTER(
                 _c,
                  LEFT(
                      _c,
                       7
                  ) = "Region "
             )
         )
     ),     _p,
     TOROW(
         SORT(
             UNIQUE(
                 TOCOL(
                     IF(
                         SEARCH(
                             "Product ",
                              rng
                         ),
                          rng,
                          x
                     ),
                      3
                 )
             )
         )
     ),     _tbl,
     IF(
         SEARCH(
             "Region ",
              _c
         ),
          _c,
          x
     ) &
     IF(
         _d,
          TRANSPOSE(
              SCAN(
                  "",
                   TRANSPOSE(
                       _d
                   ),
                   LAMBDA(
                       a,
                        v,
                        IF(
                            AND(
                                v <> "",
                                 ISTEXT(
                                     v
                                 )
                            ),
                             v,
                             a
                        )
                   )
              )
          ),
          x
     ),     _v,
     IF(
         ISTEXT(
             _tbl
         ),
          _d,
          x
     ),     _res,
     IFERROR(
         MAP(
             _r & _p,
              LAMBDA(
                  a,
                   SUM(
                       TOCOL(
                           IF(
                               _tbl = a,
                                _v,
                                x
                           ),
                            3
                       )
                   )
              )
         ),
          0
     ),     VSTACK(
         HSTACK(
             C3,
              _p
         ),
          HSTACK(
              _r,
               _res
          )
     ))
Excel solution 10 for Combine Tables, proposed by Sunny Baggu:
=LET(
 _c1,
     VSTACK(          TOCOL(
              C4:C6 & D3:F3
          ),          TOCOL(
              C10:C12 & D9:G9
          ),          TOCOL(
              C16:C18 & D15:F15
          )     ), _c2,
     VSTACK(
         TOCOL(
             D4:F6
         ),
          TOCOL(
              D10:G12
          ),
          TOCOL(
              D16:F18
          )
     ), _r,
     UNIQUE(
         VSTACK(
             C4:C6,
              C10:C12,
              C16:C18
         )
     ), _p,
     SORT(
         UNIQUE(
             HSTACK(
                 D3:F3,
                  D9:G9,
                  D15:F15
             ),
              1
         ),
          ,
          ,
          1
     ), _v,
     MAP(_r & _p,
     LAMBDA(x,
     SUM((_c1 = x) * _c2))), VSTACK(
     HSTACK(
         C3,
          _p
     ),
      HSTACK(
          _r,
           _v
      )
 )
)
Excel solution 11 for Combine Tables, proposed by Hussein SATOUR:
=LET(
    f,
    LAMBDA(
        x,
        LET(
            a,
            TOCOL(
                DROP(
                    INDEX(
                        x,
                        ,
                        1
                    )&INDEX(
                        x,
                        1,
                        0
                    ),
                    1,
                    1
                )
            ),
            HSTACK(
                LEFT(
                    a,
                    8
                ),
                RIGHT(
                    a,
                    9
                ),
                TOCOL(
                    DROP(
                        x,
                        1,
                        1
                    )
                )
            )
        )
    ),
    b,
    VSTACK(
        f(
            C3:F6
        ),
        f(
            C9:G12
        ),
        f(
            C15:F18
        )
    ),
    PIVOTBY(
        INDEX(
            b,
            ,
            1
        ),
        INDEX(
            b,
            ,
            2
        ),
        INDEX(
            b,
            ,
            3
        ),
        SUM,
        ,
        0,
        ,
        0
    )
)
Excel solution 12 for Combine Tables, proposed by LEONARD OCHEA 🇷🇴:
=LET(
    a,
    C3:F6,
    b,
    C9:G12,
    c,
    C15:F18,
    F,
    LAMBDA(
        x,
        y,
        TOCOL(
            IF(
                x,
                IFS(
                    y=1,
                    TAKE(
                        x,
                        ,
                        1
                    ),
                    y=2,
                    TAKE(
                        x,
                        1
                    ),
                    y=0,
                    x
                )
            ),
            2
        )
    ),
    r,
    VSTACK(
        F(
            a,
            1
        ),
        F(
            b,
            1
        ),
        F(
            c,
            1
        )
    ),
    p,
    VSTACK(
        F(
            a,
            2
        ),
        F(
            b,
            2
        ),
        F(
            c,
            2
        )
    ),
    d,
    VSTACK(
        F(
            a,

        ),
        F(
            b,

        ),
        F(
            c,

        )
    ),
    PIVOTBY(
        r,
        p,
        d,
        SUM,
        ,
        0,
        ,
        0
    )
)

With variable V to replace the VSTACK function

=LET(
    a,
    C3:F6,
    b,
    C9:G12,
    c,
    C15:F18,
    V,
    VSTACK,
    F,
    LAMBDA(
        x,
        y,
        TOCOL(
            IF(
                x,
                IFS(
                    y=1,
                    TAKE(
                        x,
                        ,
                        1
                    ),
                    y=2,
                    TAKE(
                        x,
                        1
                    ),
                    y=0,
                    x
                )
            ),
            2
        )
    ),
    r,
    V(
        F(
            a,
            1
        ),
        F(
            b,
            1
        ),
        F(
            c,
            1
        )
    ),
    p,
    V(
        F(
            a,
            2
        ),
        F(
            b,
            2
        ),
        F(
            c,
            2
        )
    ),
    d,
    V(
        F(
            a,

        ),
        F(
            b,

        ),
        F(
            c,

        )
    ),
    PIVOTBY(
        r,
        p,
        d,
        SUM,
        ,
        0,
        ,
        0
    )
)
Excel solution 13 for Combine Tables, proposed by Tyler Cameron:
=LET(
    a,
    "Product "&TOROW(
        CHAR(
            SEQUENCE(
                5,
                ,
                65
            )
        )
    ),
    z,
    LAMBDA(
        t,
        u,
        v,