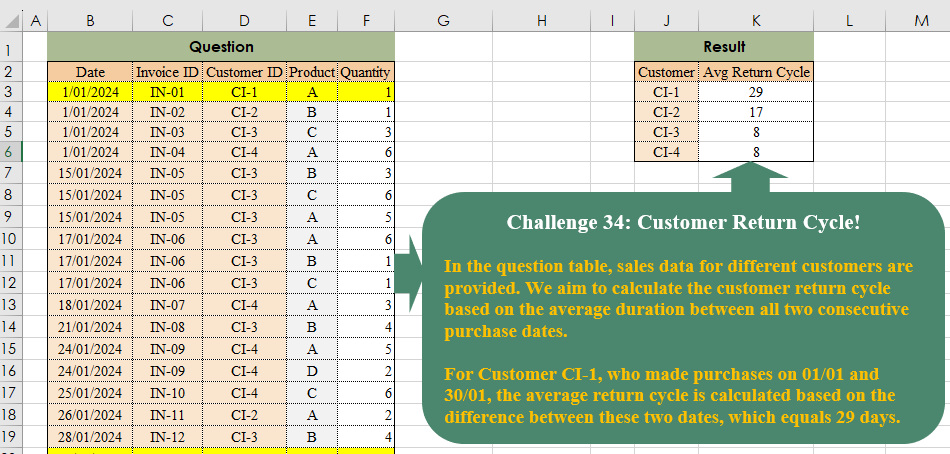
In the question table, sales data for different customers are provided. We aim to calculate the customer return cycle based on the average duration between all two consecutive purchase dates. For Customer CI-1, who made purchases on 01/01 and 30/01, the average return cycle is calculated based on the difference between these two dates, which equals 29 days.
📌 Challenge Details and Links
Challenge Number: 34
Challenge Difficulty: ⭐⭐⭐
📥Download Sample File
📥Link to the solutions on LinkedIn
Solving the challenge of Customer Return Cycle! with Power Query
Power Query solution 1 for Customer Return Cycle!, proposed by Brian Julius:
let
  Source = Table.TransformColumnTypes(
    Table.SelectColumns(
      Excel.CurrentWorkbook(){[Name = "Table1"]}[Content],
      {"Date", "Customer ID"}
    ),
    {"Date", Date.Type}
  ),
  Grouped = Table.Group(Source, {"Customer ID"}, {"All", each Table.Distinct(_)}),
  AddAvg = Table.AddColumn(
    Grouped,
    "Average",
    each [
      a = _[All][Date],
      b = List.Transform(a, each Number.From(_)),
      c = List.Skip(List.Transform(b, each _ - b{List.PositionOf(b, _) - 1}), 1),
      d = List.Average(c)
    ][d]
  ),
  Clean = Table.RemoveColumns(AddAvg, {"All"})
in
  Clean
Power Query solution 2 for Customer Return Cycle!, proposed by Ramiro Ayala Chávez:
let
S = Excel.CurrentWorkbook(){[Name="Table1"]}[Content],
T = Table.AddColumn,
L = List.Transform,
a = Table.Group(S[[Date],[Customer ID]],{"Customer ID"},{"G", each _}),
b = Table.TransformColumns(a,{"G", each Table.AddIndexColumn(_,"I")}),
c = T(b,"H", each let x=[G], y=T(x,"P", each try x[Date]{[I]-1} otherwise null) in y)[H],
d = L(c, each T(_,"D", each Duration.Days([Date]-[P]))[D]),
e = L(d, each Number.Round(List.Average(List.Select(List.Skip(_), each _<>0)))),
Sol = Table.FromColumns({b[Customer ID],e},{"Customer","Avg Return Cycle"})
in
Sol
Power Query solution 3 for Customer Return Cycle!, proposed by Aditya Kumar Darak 🇮🇳:
let
  Source = Excel.CurrentWorkbook(){[Name = "data"]}[Content],
  Answer = Table.Group(
    Source,
    "Customer ID",
    {
      "Average Return Cycle",
      each [
        Min   = List.Min([Date]),
        Max   = List.Max([Date]),
        Count = List.Count(List.Distinct([Date])) - 1,
        R     = Number.From(Max - Min) / Count
      ][R]
    }
  )
in
  Answer
Power Query solution 4 for Customer Return Cycle!, proposed by Alejandro Simón 🇵🇦 🇪🇸:
let
 Source = Excel.CurrentWorkbook(){[Name="Table1"]}[Content],
 Sol = Table.Group(Source, {"Customer ID"}, {{"Avg", each
let
a = List.Distinct([Date]),
b = List.Transform({0..List.Count(a)-1}, each Number.From(a{_+1}?-a{_})),
c = List.Average(List.RemoveNulls(b))
in c}})
in
 Sol
Power Query solution 5 for Customer Return Cycle!, proposed by 🇮🇷 Navid Esmaeilzadeh اسماعیل زاده:
let
  S = Excel.CurrentWorkbook(){[Name = "Table1"]}[Content],
  R = Table.SelectColumns(S, {"Customer ID", "Date"}),
  M = Table.Group(
    R,
    {"Customer ID"},
    {{"Tbl", each _, type table [Customer ID = text, Date = datetime]}}
  ),
  F = (X) =>
    let
      A = Table.TransformColumnTypes(X, {{"Date", type date}}),
      R = Table.Distinct(A, {"Date"}),
      B = Table.AddIndexColumn(R, "Index", 0, 1, Int64.Type),
      C = Table.AddColumn(B, "Duration", each try [Date] - B[Date]{[Index] - 1} otherwise null),
      D = Table.Group(
        C,
        {"Customer ID"},
        {{"AVG", each List.Average([Duration]), type nullable duration}}
      ),
      E = Table.TransformColumns(D, {{"AVG", Duration.TotalDays, type number}})
    in
      E,
  N = Table.AddColumn(M, "F", each F([Tbl])),
  Z = Table.SelectColumns(N, {"F"}),
  Sol = Table.ExpandTableColumn(Z, "F", {"Customer ID", "AVG"}, {"Customer ID", "AVG"})
in
  Sol
Power Query solution 6 for Customer Return Cycle!, proposed by Glyn Willis:
let
  Source = Excel.CurrentWorkbook(){[Name = "Table1"]}[Content],
  #"Changed Type" = Table.TransformColumnTypes(
    Source,
    {
      {"Date", type date},
      {"Invoice ID", type text},
      {"Customer ID", type text},
      {"Product", type text},
      {"Quantity", Int64.Type}
    }
  ),
  #"Grouped Rows" = Table.Group(
    #"Changed Type",
    {"Customer ID"},
    {
      {
        "avg Return Cycle",
        each
          let
            t = Table.Distinct(_, {"Customer ID", "Invoice ID", "Date"})[Date],
            l = List.Zip({List.RemoveLastN(t, 1), List.RemoveFirstN(t, 1)}),
            d = List.Transform(l, (x) => Duration.Days(x{1} - x{0}))
          in
            List.Average(d),
        type number
      }
    }
  ),
  #"Sorted Rows" = Table.Sort(#"Grouped Rows", {{"Customer ID", Order.Ascending}})
in
  #"Sorted Rows"
Power Query solution 7 for Customer Return Cycle!, proposed by Kerwin Tan CPA:
let
  Source = Excel.CurrentWorkbook(){[Name = "Table1"]}[Content],
  #"Changed Type" = Table.TransformColumnTypes(
    Source,
    {
      {"Date", type date},
      {"Invoice ID", type text},
      {"Customer ID", type text},
      {"Product", type text},
      {"Quantity", Int64.Type}
    }
  ),
  Output = Table.Group(
    #"Changed Type",
    {"Customer ID"},
    {
      {
        "Avg Return Cycle",
        each
          let
            a = List.Distinct([Date]),
            b = List.Positions(a)
          in
            List.Average(
              List.RemoveNulls(
                List.Accumulate(
                  b,
                  {},
                  (x, y) => x & {try Duration.Days(a{y} - a{y - 1}) otherwise null}
                )
              )
            )
      }
    }
  )
in
  Output
Solving the challenge of Customer Return Cycle! with Excel
Excel solution 1 for Customer Return Cycle!, proposed by Bo Rydobon 🇹🇭:
=GROUPBY(D3:D26,
    B3:B26,
    LAMBDA(x,
    (MAX(
        x
    )-@x)/(ROWS(
        UNIQUE(
        x
    )
    )-1)),
    ,
    0)
Excel solution 2 for Customer Return Cycle!, proposed by Oscar Mendez Roca Farell:
=LET(B,
     B3:B26,
     D,
     D3:D26,
     U,
     UNIQUE(
         D3:D26
     ),
     HSTACK(U,
     MAP(U,
     LAMBDA(a,
     LET(F,
     UNIQUE(
         FILTER(
             B,
              D=a
         )
     ),
     (MAX(
         F
     )-@F)/(ROWS(
         F
     )-1))))))
Excel solution 3 for Customer Return Cycle!, proposed by Julian Poeltl:
=LET(
    T,
    B2:F26,
    TT,
    DROP(
        T,
        1
    ),
    D,
    TAKE(
        TT,
        ,
        1
    ),
    C,
    CHOOSECOLS(
        TT,
        3
    ),
    CU,
    UNIQUE(
        C
    ),
    ARC,
    MAP(
        CU,
        LAMBDA(
            IX,
            AVERAGE(
                ABS(
                    DROP(
                        UNIQUE(
                            FILTER(
                                D,
                                C=IX
                            )
                        )-DROP(
                            UNIQUE(
                            FILTER(
                                D,
                                C=IX
                            )
                        ),
                            1
                        ),
                        -1
                    )
                )
            )
        )
    ),
    VSTACK(
        HSTACK(
            "Customer",
            "Avg Return Cycle"
        ),
        HSTACK(
            CU,
            ARC
        )
    )
)
Excel solution 4 for Customer Return Cycle!, proposed by Kris Jaganah:
=LET(
    p,
    D3:D26,
    q,
    UNIQUE(
        p
    ),
    HSTACK(
        q,
        MAP(
            q,
            LAMBDA(
                x,
                LET(
                    a,
                    UNIQUE(
                        FILTER(
                            B3:B26,
                            p=x
                        )
                    ),
                    AVERAGE(
                        DROP(
                            a,
                            1
                        )-DROP(
                            a,
                            -1
                        )
                    )
                )
            )
        )
    )
)
Excel solution 5 for Customer Return Cycle!, proposed by John Jairo Vergara Domínguez:
=GROUPBY(
    D3:D26,
    B3:B26,
    LAMBDA(
        x,
        AVERAGE(
            DROP(
                UNIQUE(
                    x
                ),
                1
            )-DROP(
                UNIQUE(
                    x
                ),
                -1
            )
        )
    ),
    ,
    0
)
Excel solution 6 for Customer Return Cycle!, proposed by Sunny Baggu:
=LET(     _u,
     UNIQUE(
         D3:D26
     ),     HSTACK(          _u,          MAP(

               _u,

               LAMBDA(
                   a,

                    LET(

                         _d,
                         UNIQUE(
                             FILTER(
                                 B3:B26,
                                  D3:D26 = a
                             )
                         ),

                         AVERAGE(
                             DROP(
                                 _d,
                                  1
                             ) - DROP(
                                 _d,
                                  -1
                             )
                         )

                    )

               )

          )     ))
Excel solution 7 for Customer Return Cycle!, proposed by Hussein SATOUR:
=GROUPBY(D3:D26,
    B3:B26,
    LAMBDA(x,
    (MAX(
        x
    )-MIN(
        x
    ))/(COUNT(
        UNIQUE(
        x
    )
    )-1)),
    ,
    0)
Excel solution 8 for Customer Return Cycle!, proposed by LEONARD OCHEA 🇷🇴:
=GROUPBY(D3:D26,
    B3:B26,
    LAMBDA(a,
    LET(b,
    UNIQUE(
        a
    )-MIN(
        a
    ),
    MAX(
        b
    )/(ROWS(
        b
    )-1))),
    ,
    0)
Excel solution 9 for Customer Return Cycle!, proposed by LUIS FLORENTINO COUTO CORTEGOSO:
=LET(
    H,
    LAMBDA(
        i,
        j,
        DROP(
            i,
            j
        )
    ),
    x,
    B3:B26,
    y,
    D3:D26,
    f,
    SORTBY(
        x,
        y,
        1,
        x,
        1
    ),
    c,
    SORT(
        y
    ),
    d,
    MAP(
        H(
            f,
            -1
        ),
        H(
            f,
            1
        ),
        H(
            c,
            -1
        ),
        H(
            c,
            1
        ),
        LAMBDA(
            a,
            b,
            c,
            d,
            IF(
                c=d,
                b-a,
                0
            )
        )
    ),
    g,
    H(
            c,
            -1
        ),
    GROUPBY(
        g,
        d,
        AVERAGE,
        ,
        0,
        ,
        d>0
    )
)
Excel solution 10 for Customer Return Cycle!, proposed by Tyler Cameron:
=LET(
    t,
    UNIQUE(
        D3:D26
    ),
    VSTACK(
        {"Customer",
        "Avg Return Cycle"},
        HSTACK(
            t,
            MAP(
                t,
                LAMBDA(
                    x,
                    LET(
                        a,
                        FILTER(
                            B3:B26,
                            D3:D26=x
                        ),
                        b,
                        EXPAND(
                            DROP(
                                a,
                                1
                            ),
                            ROWS(
                                a
                            )
                        ),
                        c,
                        IFNA(
                            DAYS(
                                b,
                                a
                            ),
                            0
                        ),
                        AVERAGE(
                            FILTER(
                                c,
                                c<>0
                            )
                        )
                    )
                )
            )
        )
    )
)
Solving the challenge of Customer Return Cycle! with Python
Python solution 1 for Customer Return Cycle!, proposed by Konrad Gryczan, PhD:
import pandas as pd

input = pd.read_excel("CH-034 Customer Return Cycle.xlsx", sheet_name="Sheet1", usecols="B:F", skiprows=1)
test = pd.read_excel("CH-034 Customer Return Cycle.xlsx", sheet_name="Sheet1", usecols="J:K", skiprows=1, nrows = 4)

result = input[['Date', 'Customer ID']].sort_values(by=['Customer ID', 'Date']).drop_duplicates().reset_index(drop=True)
result['lag'] = result.groupby('Customer ID')['Date'].shift(1)
result['diff'] = (result['Date'] - result['lag']).dt.days
result = result.groupby('Customer ID')['diff'].mean().astype(int).reset_index()
result.columns = ['Customer', 'Avg Return Cycle']

print(result == test)   # True
Solving the challenge of Customer Return Cycle! with R
R solution 1 for Customer Return Cycle!, proposed by Konrad Gryczan, PhD:
library(tidyverse)
library(readxl)

input = read_excel("files/CH-034 Customer Return Cycle.xlsx", range = "B2:F26")
test = read_excel("files/CH-034 Customer Return Cycle.xlsx", range = "J2:K6")

result = input %>%
 select(Date, `Customer ID`) %>%
 arrange(`Customer ID`, Date) %>%
 distinct() %>%
 mutate(lag = lag(Date), .by = `Customer ID`) %>%
 mutate(diff = Date - lag) %>%
 summarise(`Avg Return Cycle` = mean(diff, na.rm = TRUE), .by = `Customer ID`) %>%
 mutate(`Avg Return Cycle` = as.numeric(`Avg Return Cycle`)) %>%
 select(Customer = `Customer ID`, `Avg Return Cycle`)